Compiler Fuzzing in EK9
EK9 includes a built-in grammar-based fuzzer that generates random EK9 programs, compiles them, and tracks statistics including error code coverage, phase penetration, and compiler crashes. This is used for compiler quality assurance — verifying that the compiler handles every possible input gracefully.
This feature has been built into the compiler and shipped, so that anyone can test the compiler.
If you do find an crashes or issues, then let us know and supply the 'offending' ek9 source that caused
the issue. Then we can address it. We build new versions of the complier weekly, so a fix won't take long.
Looking for test generation? If you want to generate tests for your code, see Test Generation instead. This page documents the compiler fuzzer that tests the compiler itself.
- What is Compiler Fuzzing? - Why it matters
- Running the Fuzzer - CLI flags and format options
- Five-Strand Generation Strategy - How programs are generated
- Output Formats - Human, JSON, HTML, CI
- Reading the Dashboard - All dashboard sections explained
- Best Practices - Getting the most from fuzzing
What is Compiler Fuzzing?
The EK9 compiler has a 22-phase compilation pipeline, over 300 distinct error codes, and supports 29 construct types with complex interactions. Grammar-based fuzzing systematically exercises this complexity by generating random-but-structurally-plausible EK9 programs and compiling them.
The fuzzer answers three questions:
- Crash detection — Does the compiler crash on any generated input?
Crash-triggering source files are saved to
./fuzz-crashes/for investigation. - Error code coverage — How many of the compiler's ~307 error codes are exercised? Low coverage indicates untested error paths.
- Phase penetration — How far do generated programs progress through the compilation pipeline? Programs that reach later phases exercise more of the compiler.
Running the Fuzzer
The fuzzer runs for a specified number of minutes, generating and compiling programs continuously:
- $ ek9 -fuzz 30 // 30 minutes, human-readable output
- $ ek9 -fuzz0 30 // Terse CI pass/fail (one line)
- $ ek9 -fuzz2 1440 // 24 hours, JSON for pipelines
- $ ek9 -fuzz6 60 // 1 hour, HTML dashboard
The format suffix convention (-fuzz0, -fuzz2, -fuzz6) mirrors the test format convention (-t0, -t2, -t6) — each action owns its format suffixes.
Crash-triggering source files are always saved to ./fuzz-crashes/ regardless of output format. The HTML dashboard is written to ./fuzz-report/.
Five-Strand Generation Strategy
The fuzzer uses five complementary generation strategies to maximise the diversity of generated programs. Each strand produces different error distributions, and together they exercise the compiler more thoroughly than any single strategy could.
Strand 1: Template-Based ATN Generation (~30%)
The primary strand uses 25+ built-in templates for common EK9 patterns (classes, functions, traits, records, etc.) and fills them using ANTLR4 Augmented Transition Network (ATN) walks of the EK9 grammar. At each grammar decision point, the generator makes a random choice, producing structurally plausible code. This strand produces the highest density of syntactically correct programs.
Strand 2: Compiler-Aware Injection (~20%)
This strand harvests real symbols from previously compiled Q&A example files (505 templates) and injects them into generated programs. By using real type names, method signatures, and module structures, these programs exercise deeper semantic analysis phases that pure random generation rarely reaches.
Strand 3: Template Mutation (~20%)
This strand takes working Q&A example files and applies single-point mutations: dropping modifiers, swapping types, changing operators, altering indentation, duplicating lines, injecting boolean literals, stripping guards, and swapping adjacent statements. These targeted mutations exercise specific error detection paths (E08010, E08030, E08081, E11050, etc.) that random generation is unlikely to trigger.
Strand 4: Targeted Mutation (~15%)
This strand applies known-incorrect code substitutions from the Q&A system's
typicalErrors entries. Each mutation replaces a correct snippet with its
known-incorrect counterpart and verifies that the compiler detects the expected error code.
Mismatches are saved to fuzz-crashes/strand4-mismatches/ for investigation.
Strand 5: Template Enrichment (~15%)
This strand combines 1–4 working Q&A templates into a single module, extracts their type and function definitions, then generates a program body with deeply nested control flow (if/else, switch, for, while, try/catch, streams) using those real types. This bridges the gap between Strand 1 (random programs that die at FULL_RESOLUTION) and Strand 2 (flat probe calls): programs use semantically valid types in complex nested structures, reaching deeper compiler phases like IR_GENERATION and CODE_GENERATION. 15% of enriched programs receive an additional random mutation for error path coverage.
| Strand | Share | Strength |
|---|---|---|
| 1. Template-Based ATN | ~30% | High volume, broad grammar coverage, many parse errors for parser robustness |
| 2. Compiler-Aware | ~20% | Deeper phase penetration, exercises type resolution and semantic checks |
| 3. Template Mutation | ~20% | Targeted error code coverage, exercises specific detection logic |
| 4. Targeted Mutation | ~15% | Known-error validation, mismatch diagnostics, typicalErrors coverage |
| 5. Template Enrichment | ~15% | Cross-type interaction, nested control flow, deep phase penetration |
Multi-Strand Filtering and Ablation Studies
By default all five strands run with adaptive weight distribution. The -s1 through -s5 flags can be combined to run any subset of strands:
- $ ek9 -fuzz6 30 -s1 // S1 only (grammar baseline)
- $ ek9 -fuzz6 30 -s1 -s2 // S1 + S2 (grammar + symbol oracle)
- $ ek9 -fuzz6 30 -s1 -s2 -s3 // S1 + S2 + S3 (add mutation)
- $ ek9 -fuzz6 30 -s1 -s2 -s3 -s4 // S1 + S2 + S3 + S4 (add targeted)
When multiple strands are active, the adaptive weight system distributes iterations proportionally among them — strands that discover more error codes receive higher dispatch weights. Single-strand runs route 100% of iterations to that strand.
This is particularly useful for ablation studies: comparing S1-only error coverage against S1+S2, S1+S2+S3, etc. quantifies each strand's marginal contribution. The HTML dashboard includes strand effectiveness comparisons, adaptive weight timelines, and phase penetration charts that visualise these differences (see Strand Effectiveness and Adaptive Weight Timeline in the dashboard section below).
Output Formats
Human-Readable (-fuzz)
The default format prints terminal histograms, phase penetration charts, and a summary to stdout. Suitable for interactive monitoring during development:
EK9 Fuzzer: 30 minutes, seed 1709312456789
Programs: 14,832 | Parse: 72.4% | Crashes: 631 | Errors: 156/307 (50.8%)

Phase Distribution:
  READING                        ████░░░░░░░░░░░░░░░░  5.8%
  SYMBOL_DEFINITION              █████████░░░░░░░░░░░░ 23.9%
  FULL_RESOLUTION                ██████████░░░░░░░░░░░ 26.0%
  CODE_GENERATION_AGGREGATES     ████████████░░░░░░░░░ 32.3%
Terse CI (-fuzz0)
One-line pass/fail for CI gates. Returns exit code 0 if no new crashes were found:
FUZZ OK: 14832 programs, 0 new crashes, 156/307 errors (50.8%) in 30m
JSON (-fuzz2)
Produces two files for programmatic analysis:
- fuzz-report.json — Final summary with all statistics
- fuzz-snapshots.jsonl — Time-series snapshots (one JSON object per line) for tracking metrics over time
{
  "duration": "PT30M",
  "programs": 14832,
  "parseRate": 0.724,
  "crashes": 631,
  "errorCoverage": { "triggered": 156, "total": 307 },
  "phases": { "READING": 860, "SYMBOL_DEFINITION": 3546, ... },
  "constructs": { "class": 4231, "function": 3892, ... }
}
HTML Dashboard (-fuzz6)
Generates an interactive dashboard at ./fuzz-report/index.html with charts, heatmaps, and drill-down details. This is the richest output format and the recommended way to review fuzzing results.
Reading the Dashboard
The HTML dashboard (-fuzz6) provides twelve visualisation sections. Each is
described below with the key metrics to watch.
Status Banner and KPI Cards
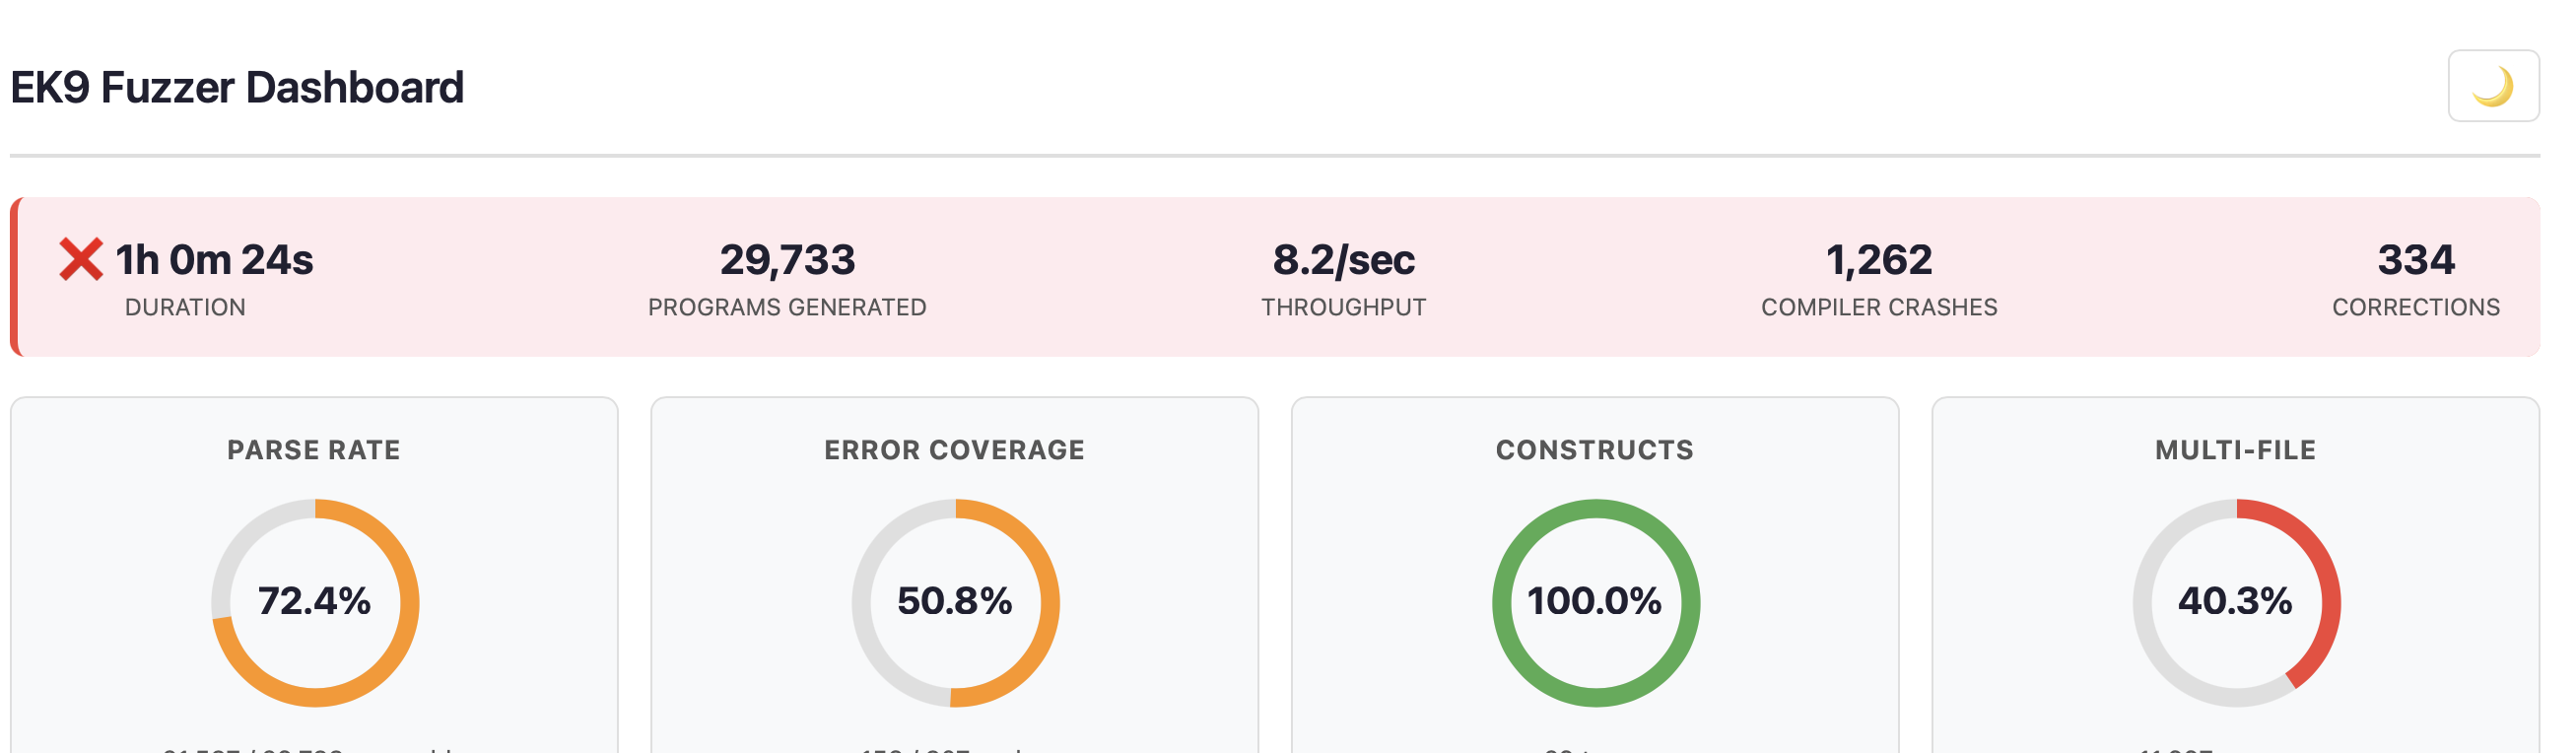
The status banner shows duration, programs generated, throughput, crash count, and corrections. The border colour indicates overall health: green (no crashes), amber (few crashes), or red (significant crashes).
Four KPI donut charts provide at-a-glance metrics:
- Parse Rate — Percentage of generated programs that parse successfully. Higher is better for exercising semantic phases, but some parse failures are expected and valuable for testing parser error recovery.
- Error Coverage — Percentage of the compiler's ~307 error codes triggered. The goal is to exercise as many error paths as possible.
- Constructs — Percentage of EK9's 29 construct types exercised (class, function, record, trait, service, etc.). Target: 100%.
- Multi-File — Percentage of programs that span multiple files, testing cross-module scenarios.
Timing Breakdown and Source Statistics
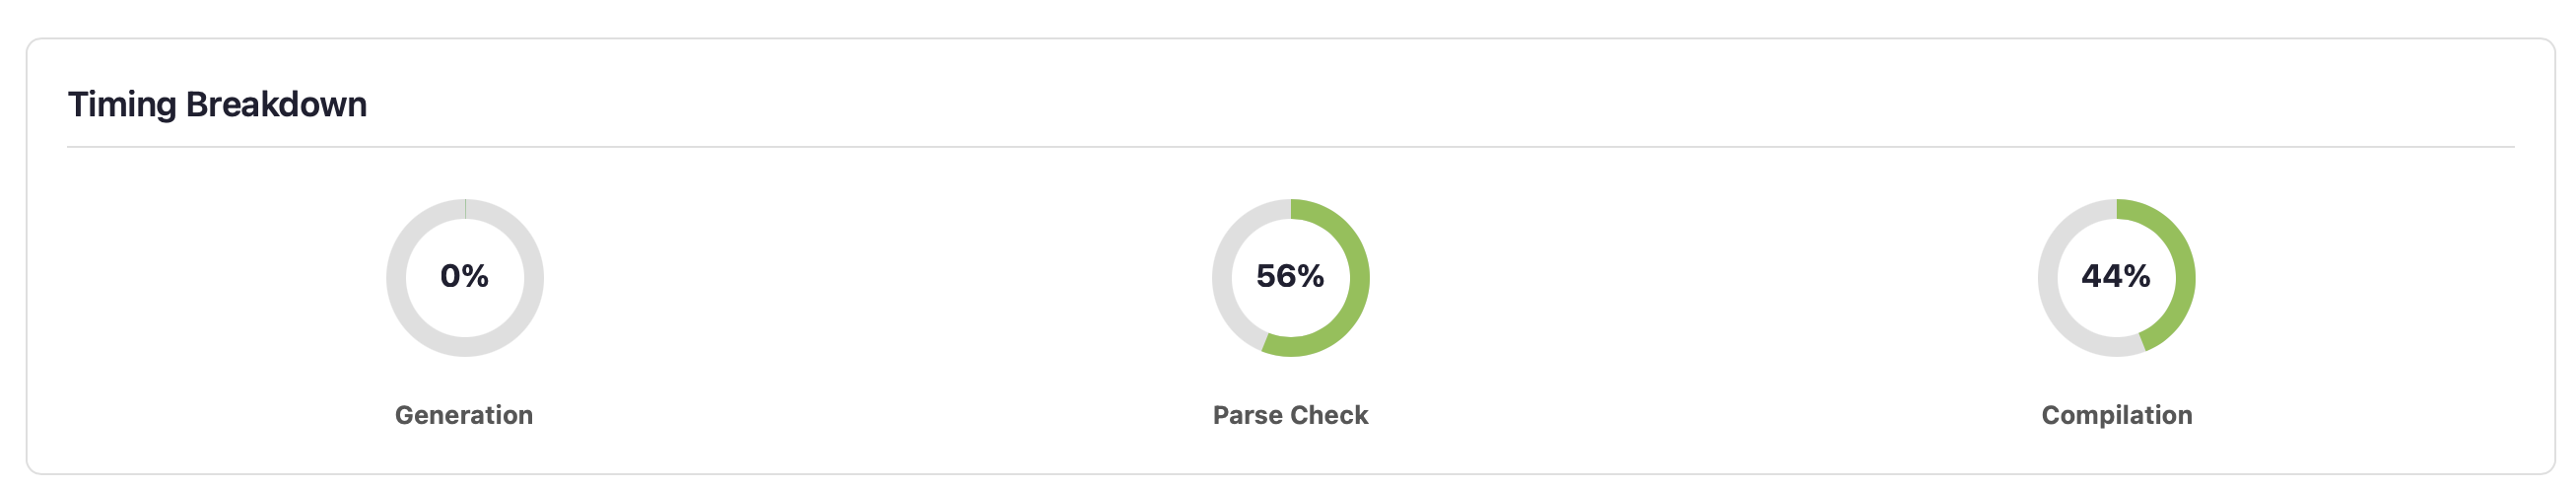
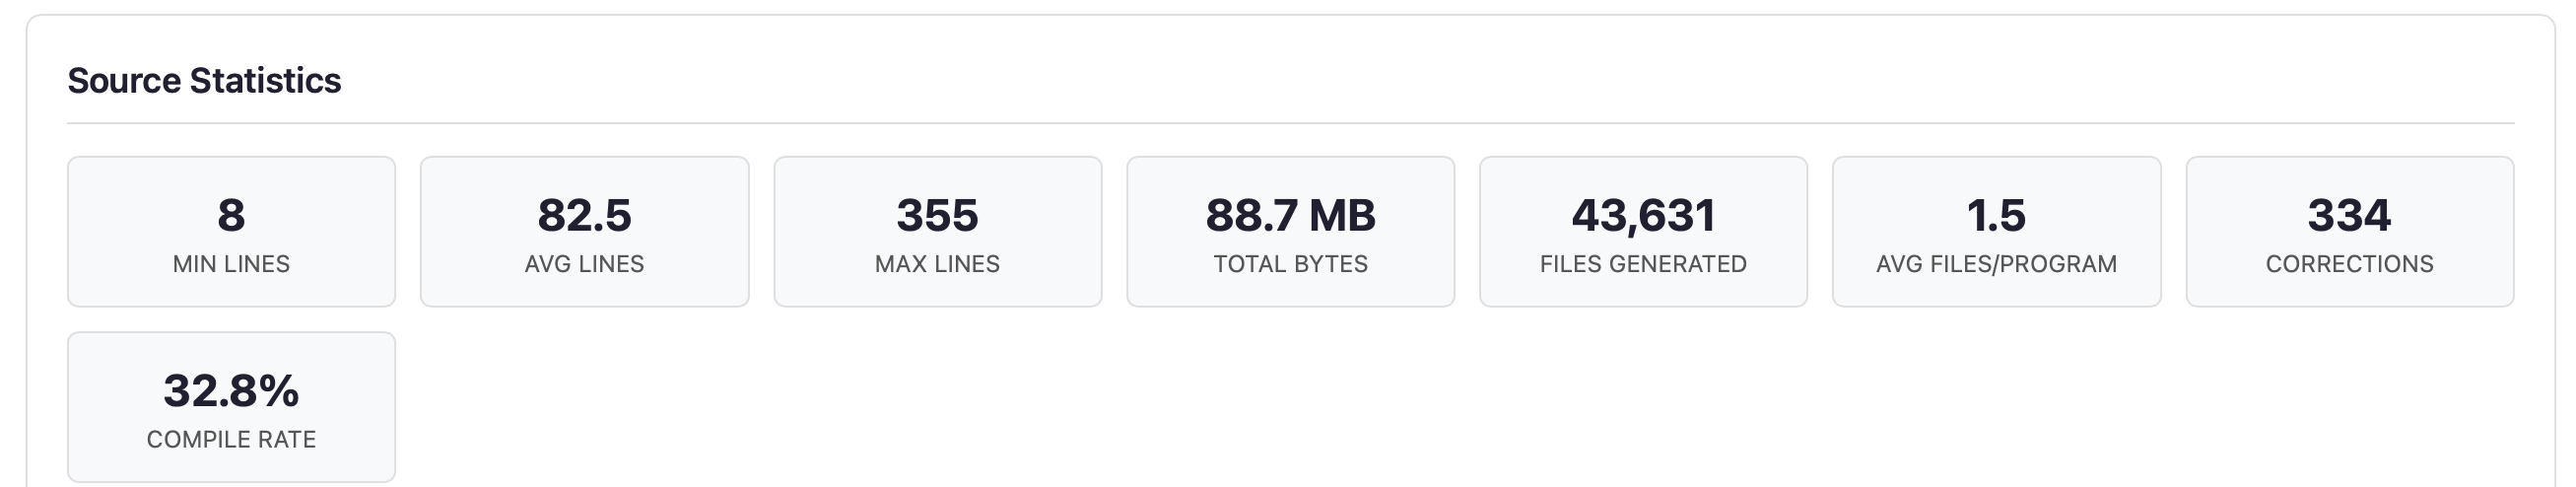
Three mini-donuts show where time is spent: generation, parse checking, and compilation. Source statistics show min/avg/max lines per program, total bytes generated, file counts, and compile rate. If compilation dominates, programs are reaching deep phases (good). If parse checking dominates, most programs fail early (consider adjusting generation strategy).
Phase Distribution
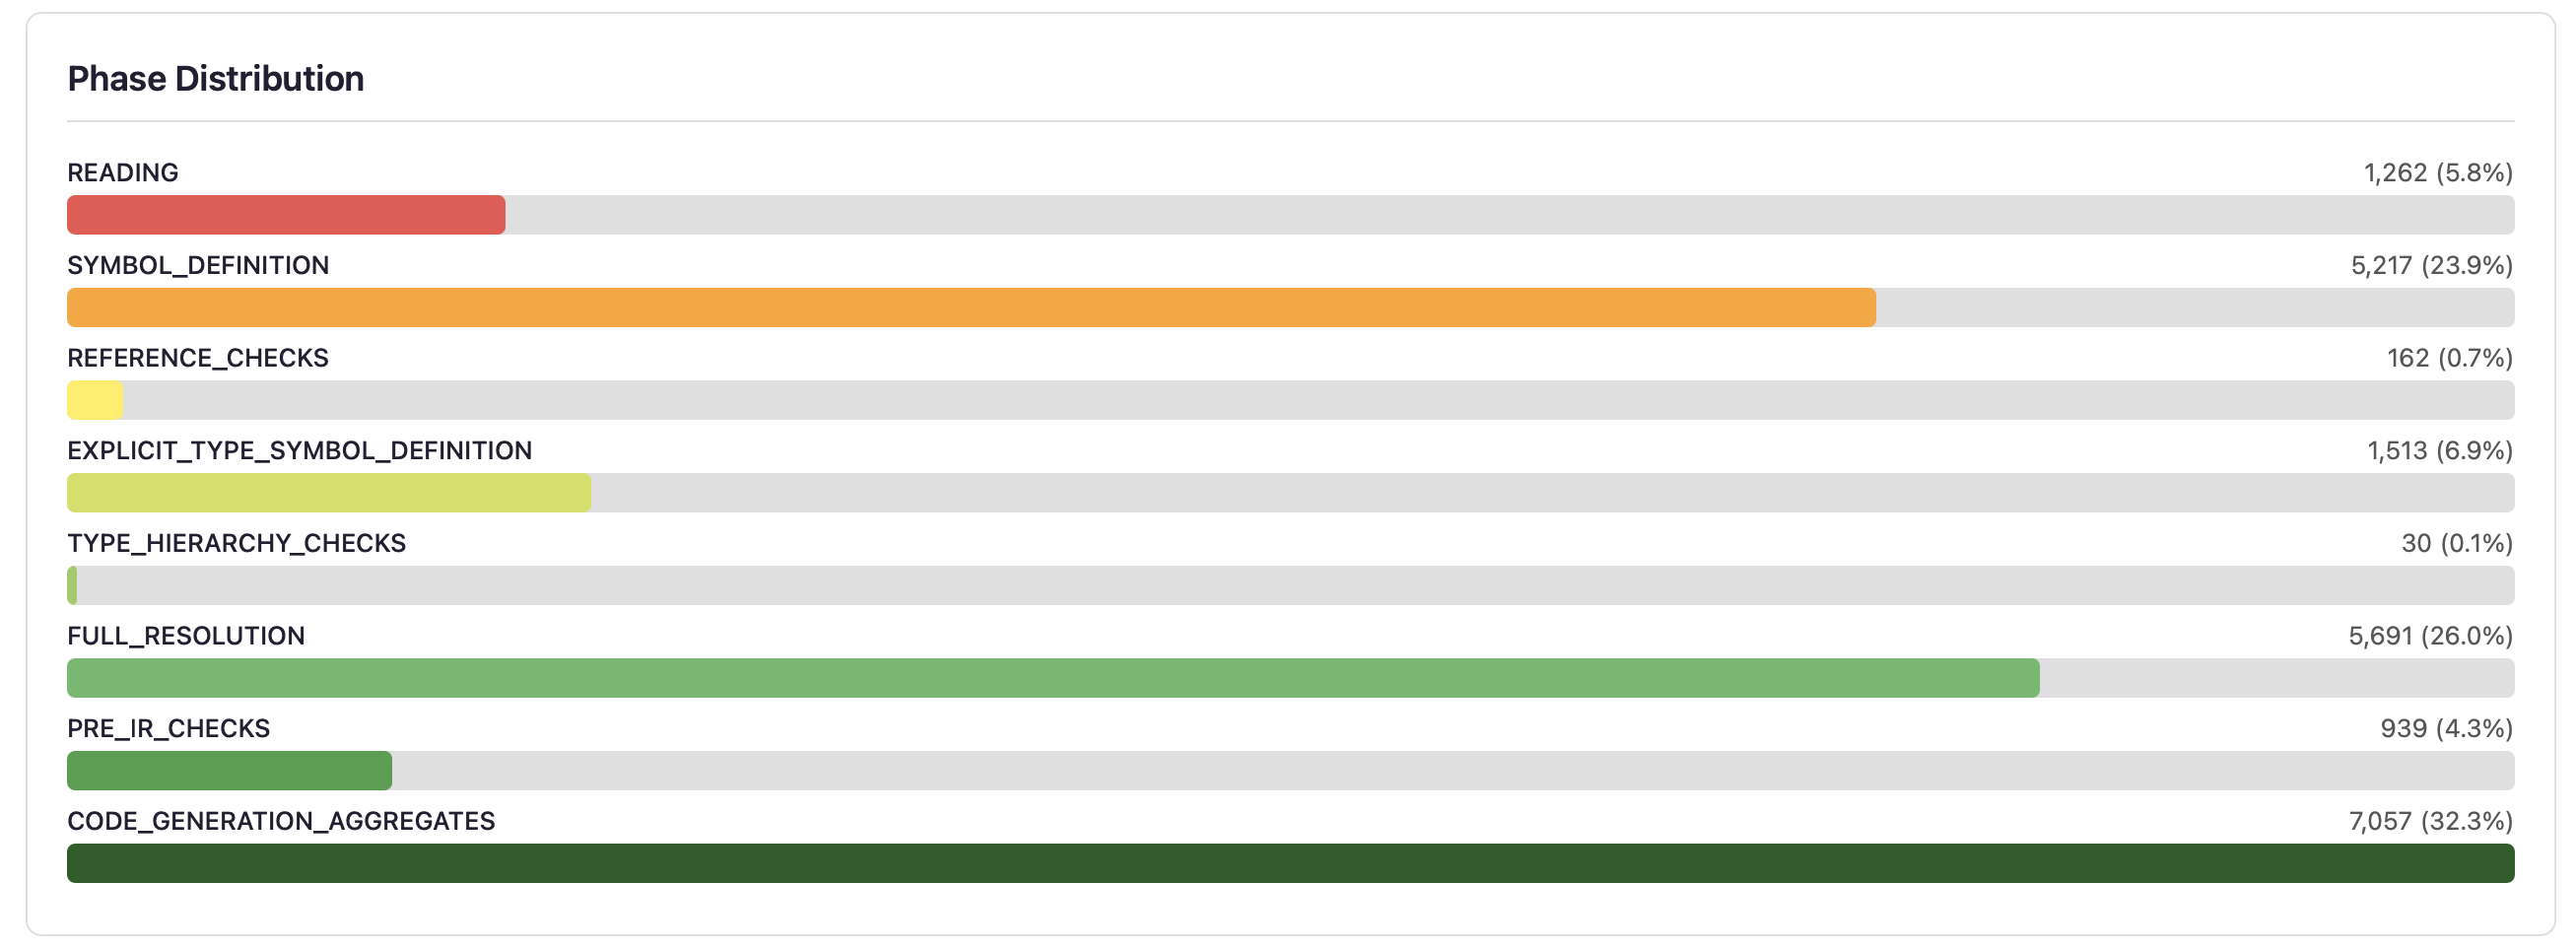
Horizontal bars show how far programs penetrate the 22-phase compilation pipeline. Each bar represents a phase where programs were rejected — programs that pass a phase move to the next bar. A healthy distribution shows programs spread across all phases, not clustered at the front.
The phase penetration funnel provides an alternative view of the same data, showing bar width proportional to the fraction of programs surviving to each phase, with dropout percentages annotated between phases:
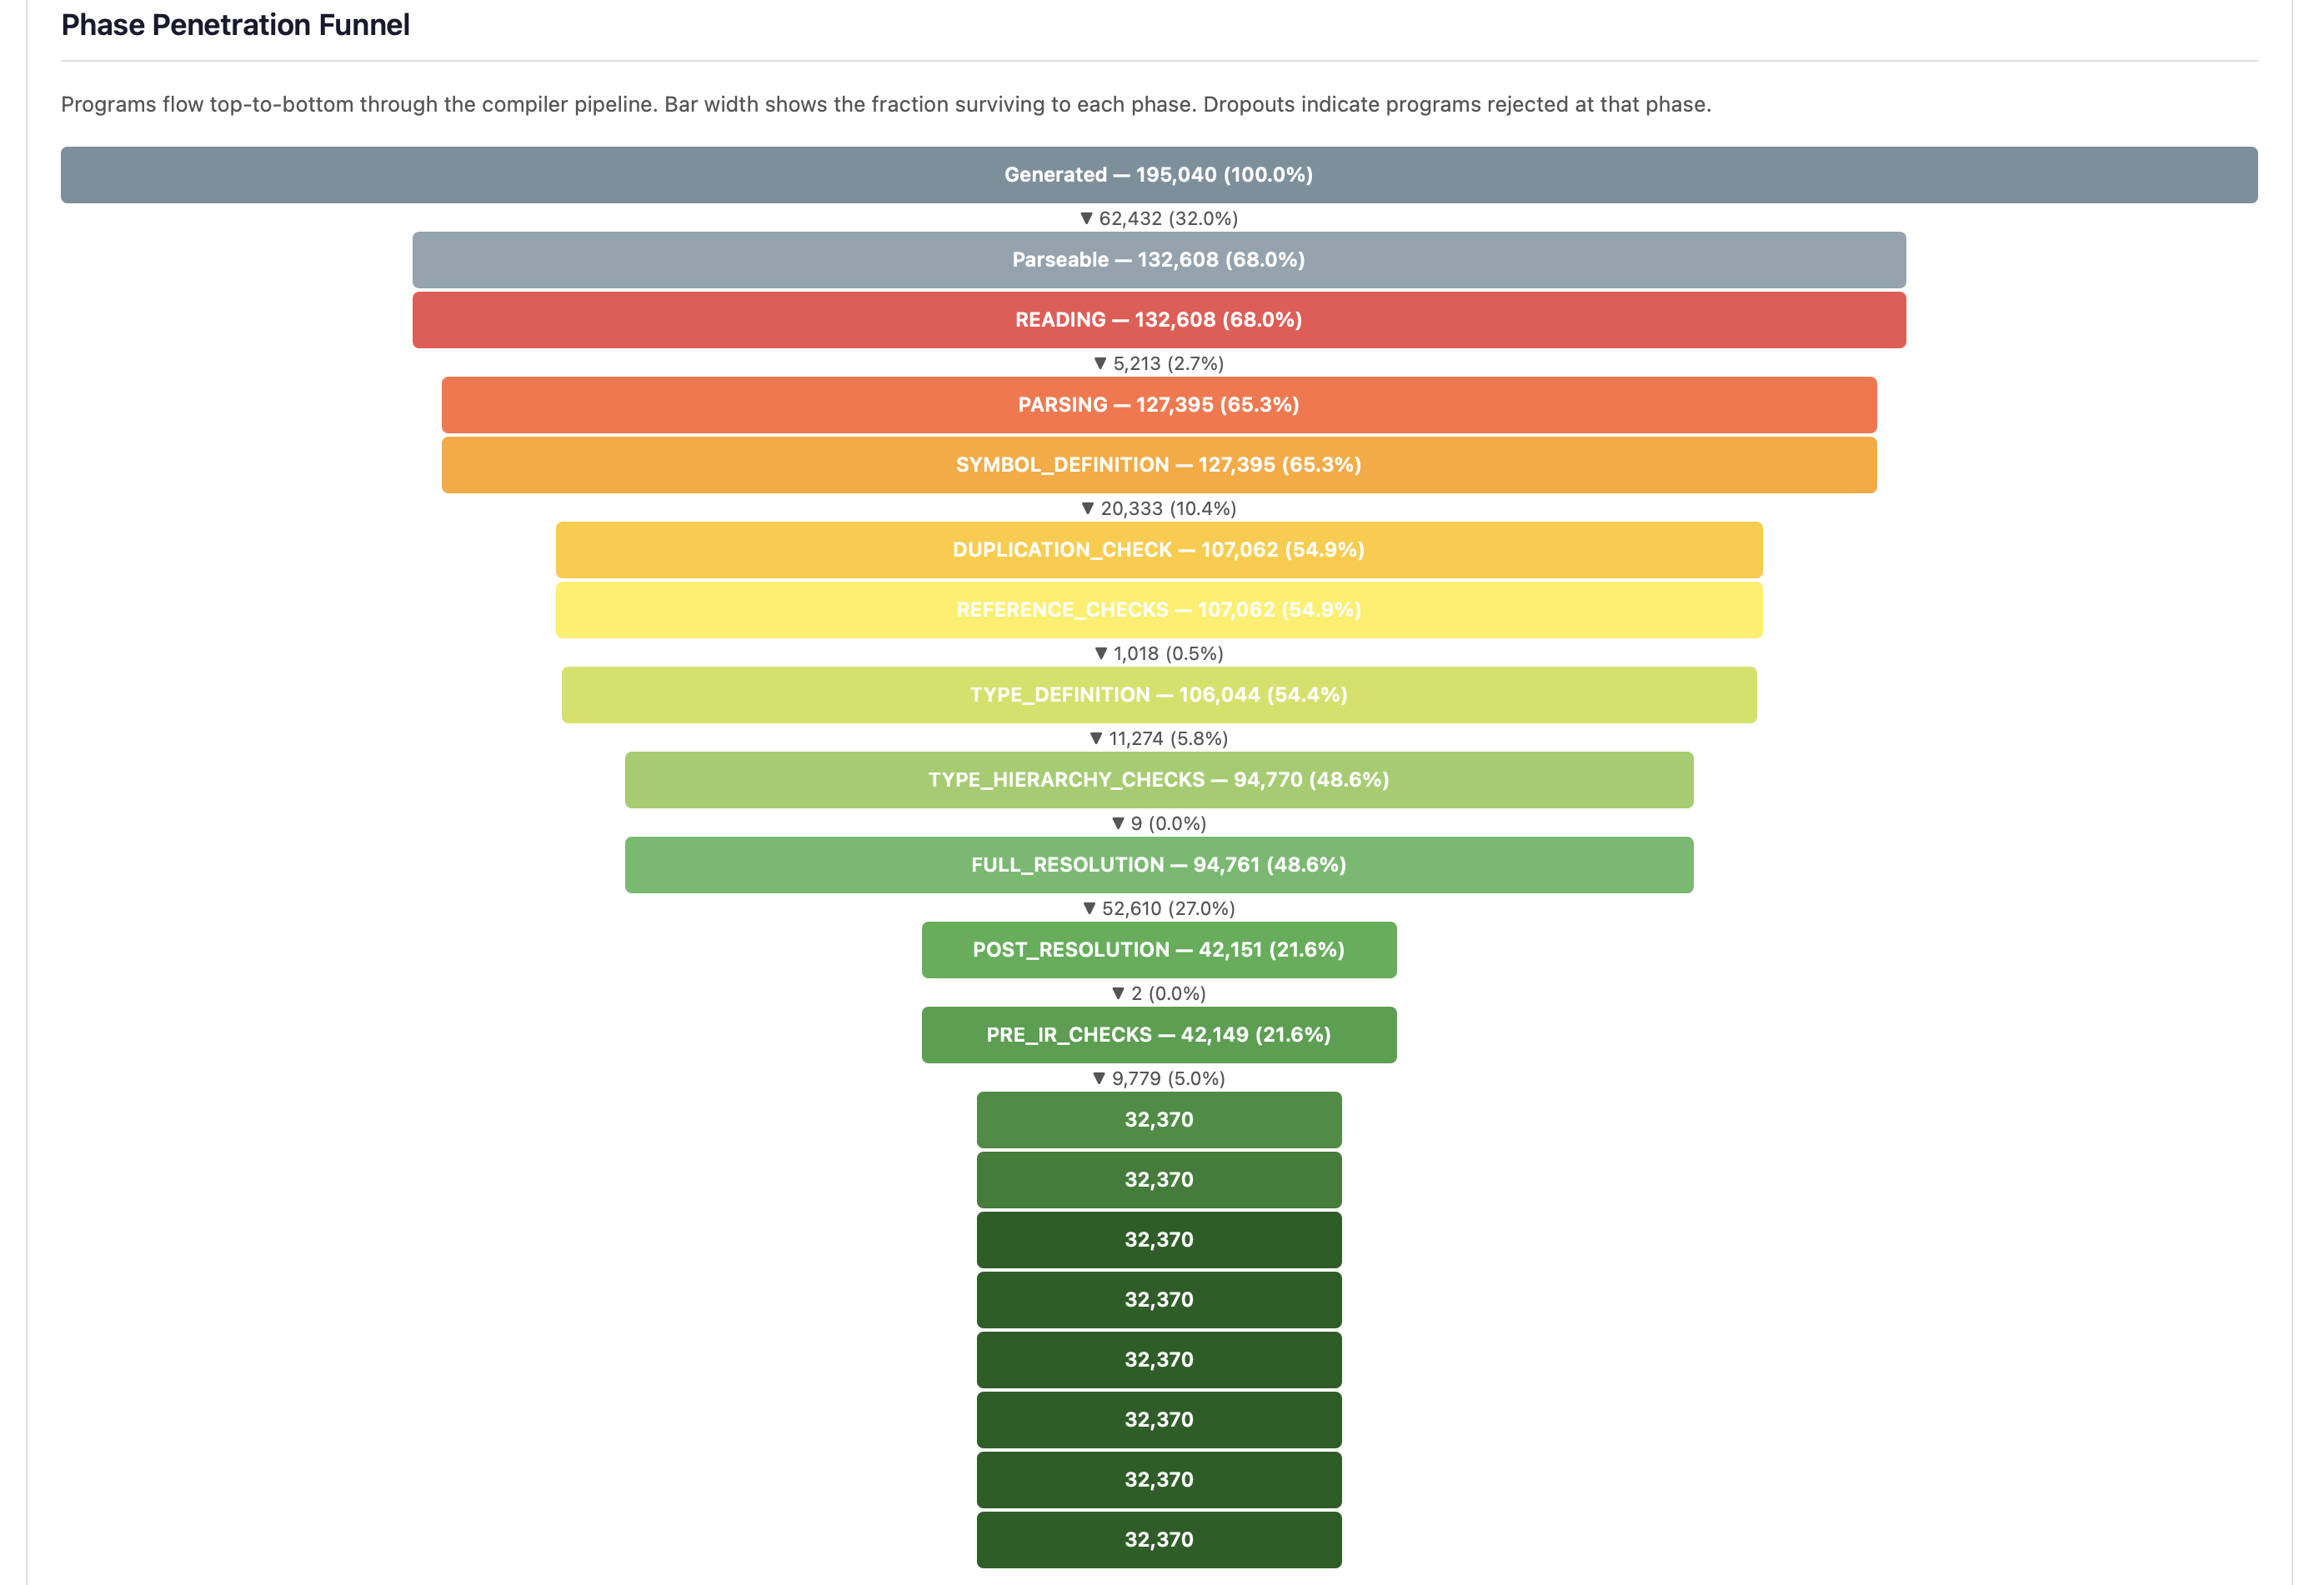
The three largest dropouts — Parsing, FULL_RESOLUTION, and SYMBOL_DEFINITION — identify where generation strategies are most often rejected. A steep drop at FULL_RESOLUTION (the single largest dropout point) reveals that type resolution is the primary barrier to deep testing.
- Early phases (READING, SYMBOL_DEFINITION) — Programs with syntax or basic structural errors. Expected from random generation.
- Middle phases (REFERENCE_CHECKS through PRE_IR_CHECKS) — Programs with type errors, unresolved references, or semantic issues. These exercise the type system.
- Late phases (CODE_GENERATION onwards) — Programs that pass all frontend checks. Crashes here indicate code generation bugs.
Error Code Coverage Heatmap
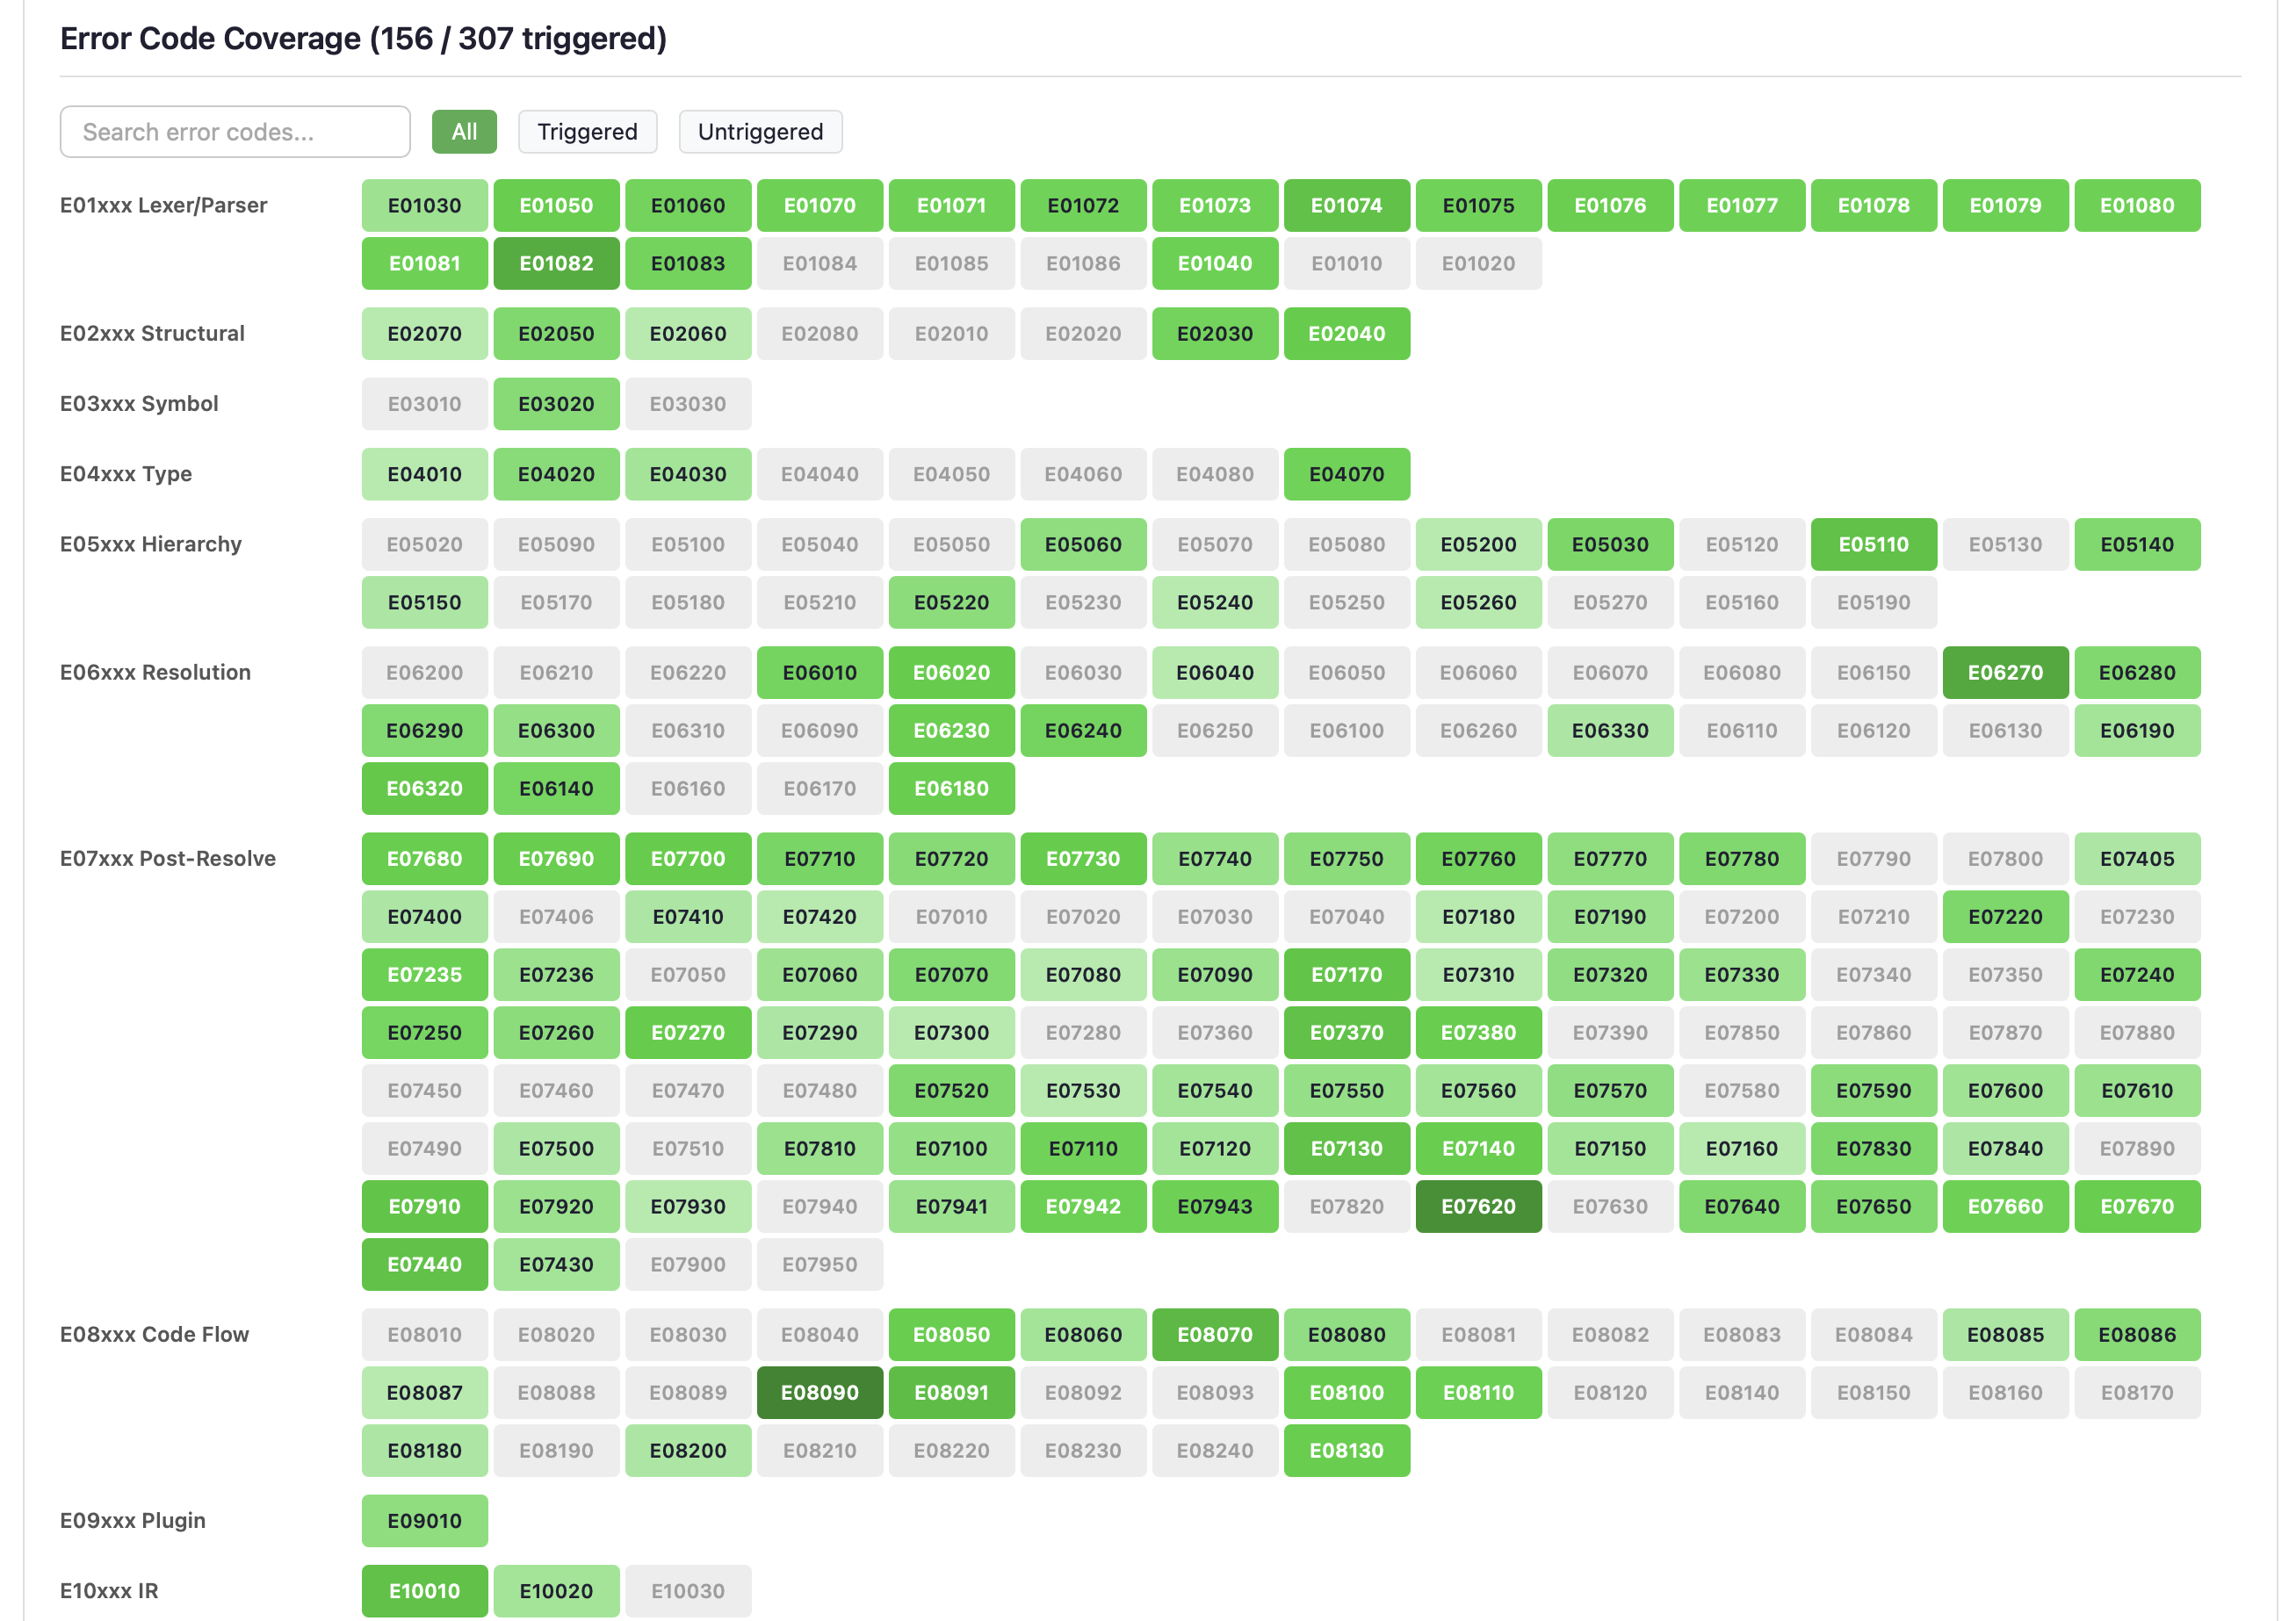
The largest dashboard section shows all ~307 compiler error codes as a searchable, filterable grid. Error codes are grouped by category (E01xxx Lexer/Parser, E05xxx Hierarchy, E06xxx Resolution, etc.).
- Green cells — Error code was triggered. Darker green indicates more hits.
- Grey cells — Error code was not triggered. These represent untested error paths that may need targeted generation strategies.
- Red crash badges — Error code triggered a compiler crash (not just an error).
Use the search box to find specific error codes, or the filter buttons (All / Triggered / Untriggered) to focus on gaps.
Construct Coverage
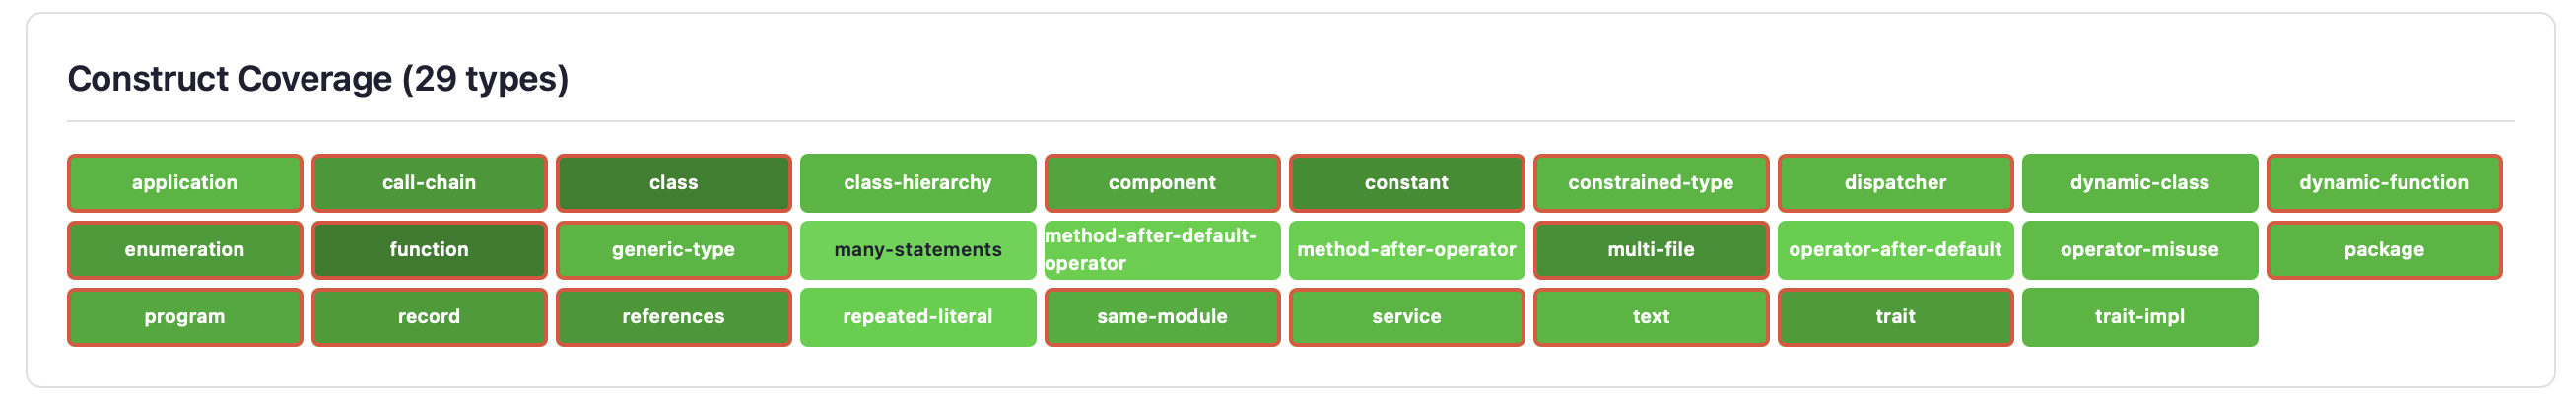
A heatmap of all 29 EK9 construct types: class, function, record, trait, service, component, program, enumeration, generic-type, dynamic-class, dynamic-function, and more. Colour intensity indicates frequency of generation. Red-bordered cells with a pulse animation indicate constructs that have caused compiler crashes.
The goal is uniform coverage across all construct types. If some constructs are underrepresented, the generation templates may need adjustment.
Control Flow Coverage
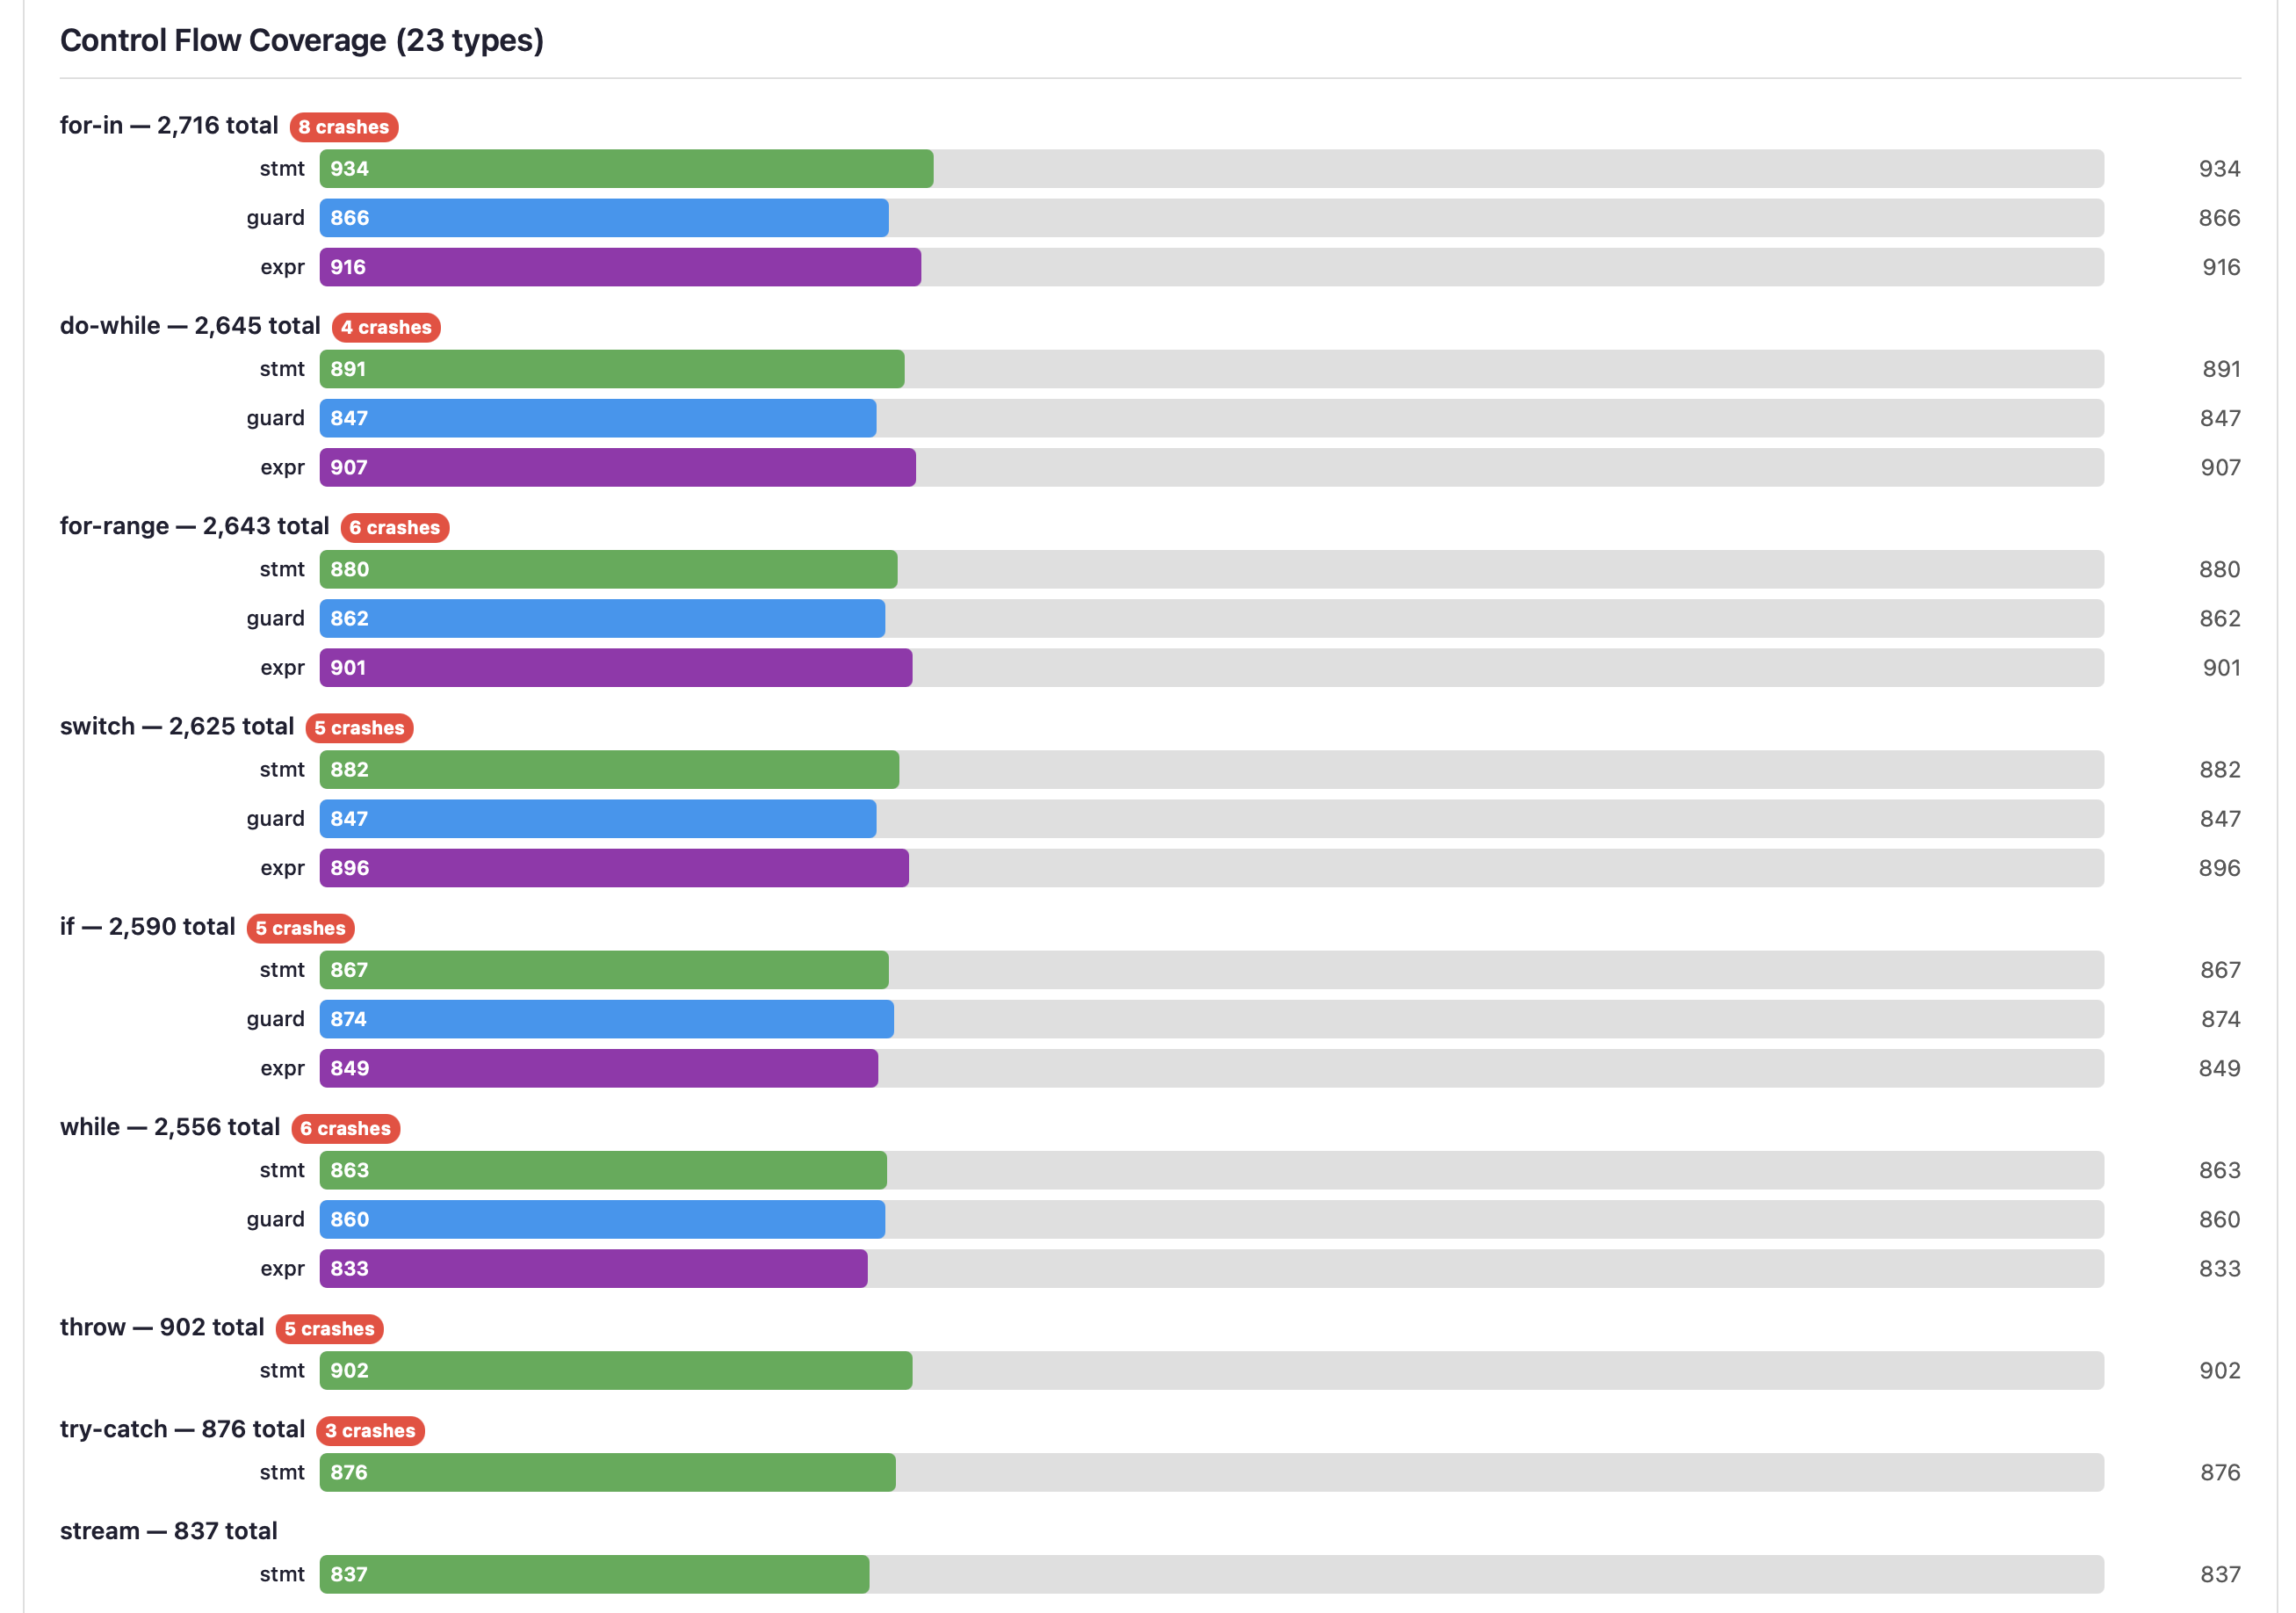
Grouped horizontal bars for each control flow type (for-in, do-while, for-range, switch, if, while, throw, try-catch, stream, etc.). Each type has three sub-bars:
- stmt (green) — Statement form (e.g.,
if condition) - guard (blue) — Guard form (e.g.,
if x <- getValue()) - expr (purple) — Expression form used in assignments
Crash badges on specific control flow types highlight where the compiler is most vulnerable. Stream operations and deeply nested constructs often reveal the most interesting bugs.
Argument Count Distribution
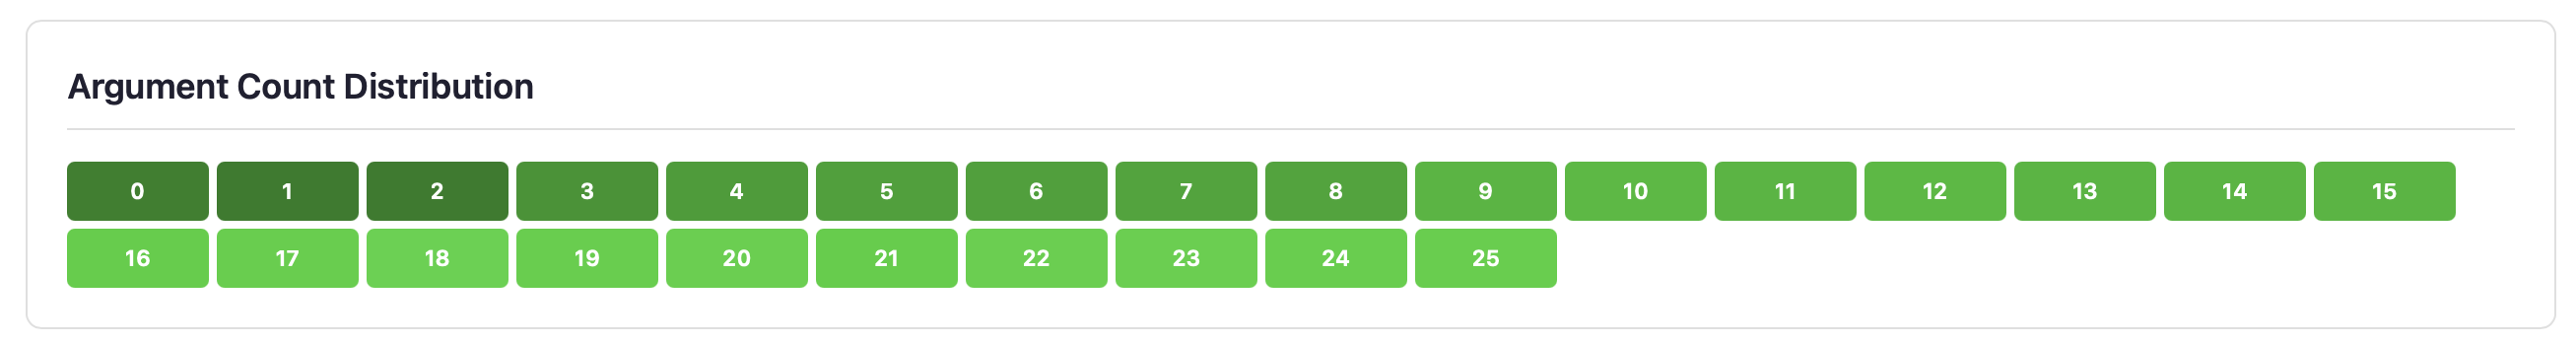
Shows the frequency distribution of argument counts (0-25+) in generated functions and methods. A realistic distribution has most functions with 0-3 parameters, with decreasing frequency for higher counts. Edge cases at 15+ parameters stress the compiler's parameter handling.
Template Usage
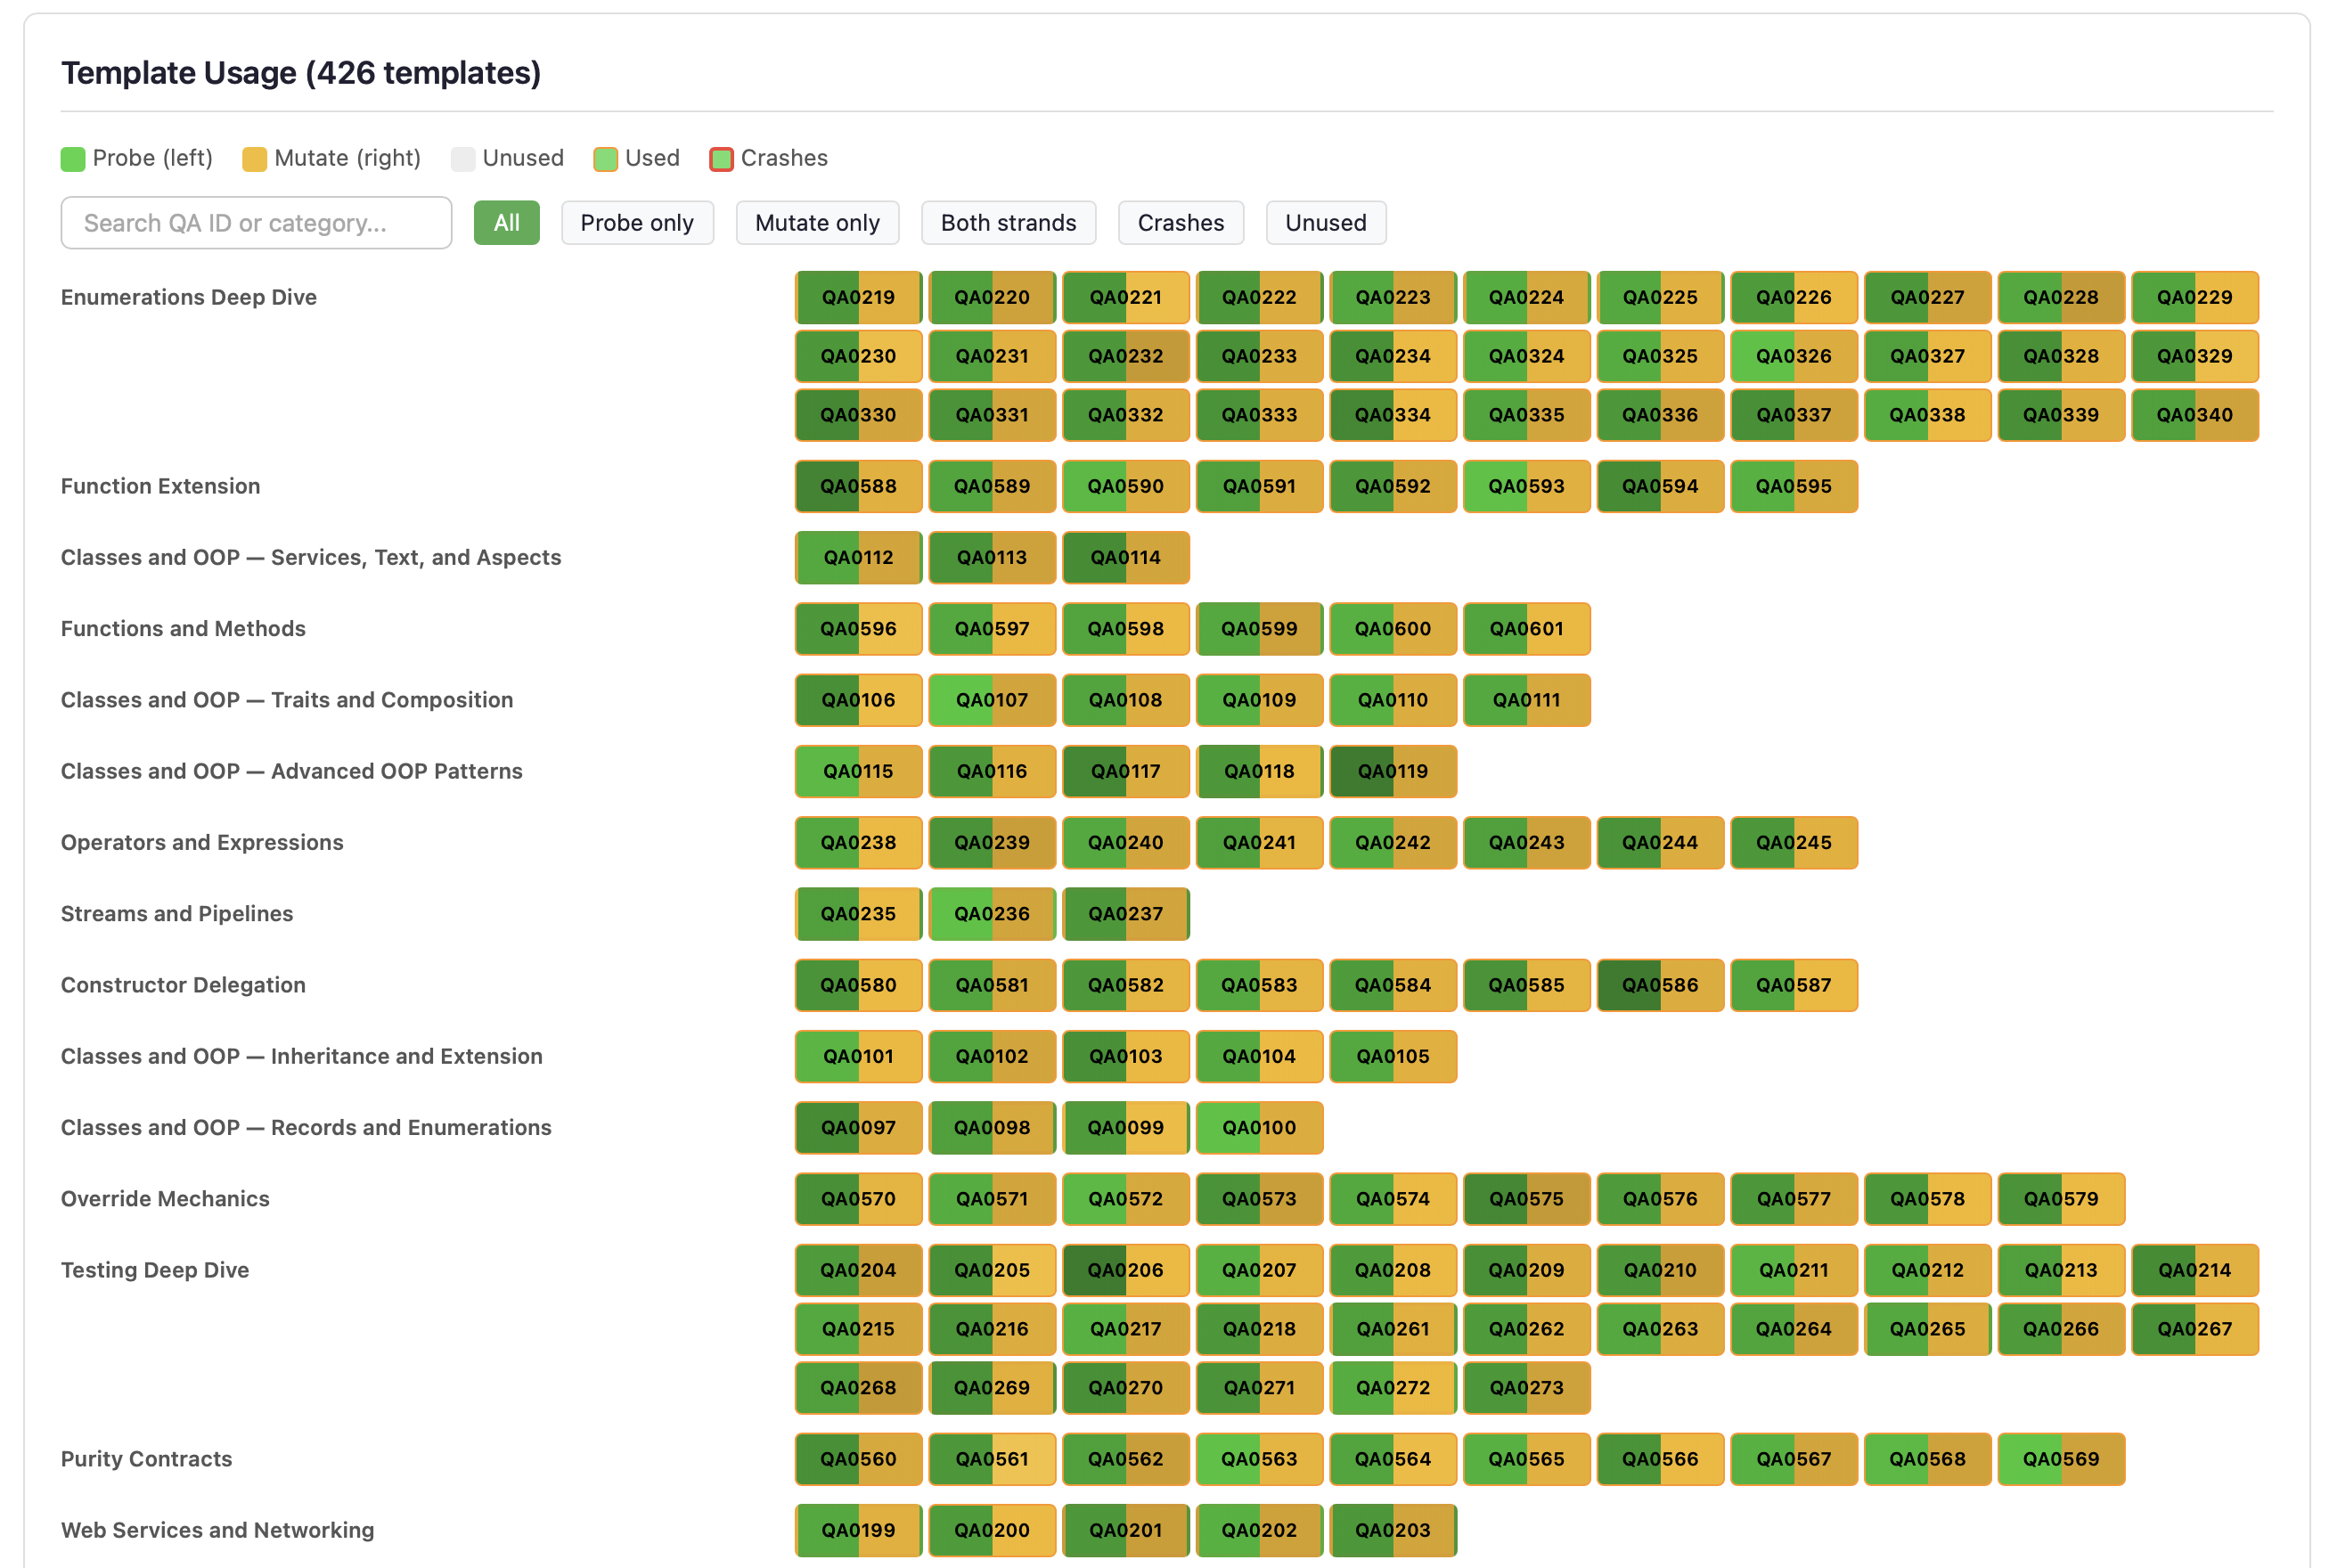
Shows utilisation of the Q&A example templates used by Strand 2 (compiler-aware injection), Strand 3 (template mutation), and Strand 5 (template enrichment). Identifies underused templates that may need attention to ensure comprehensive coverage.
Per-Strand Phase Distribution
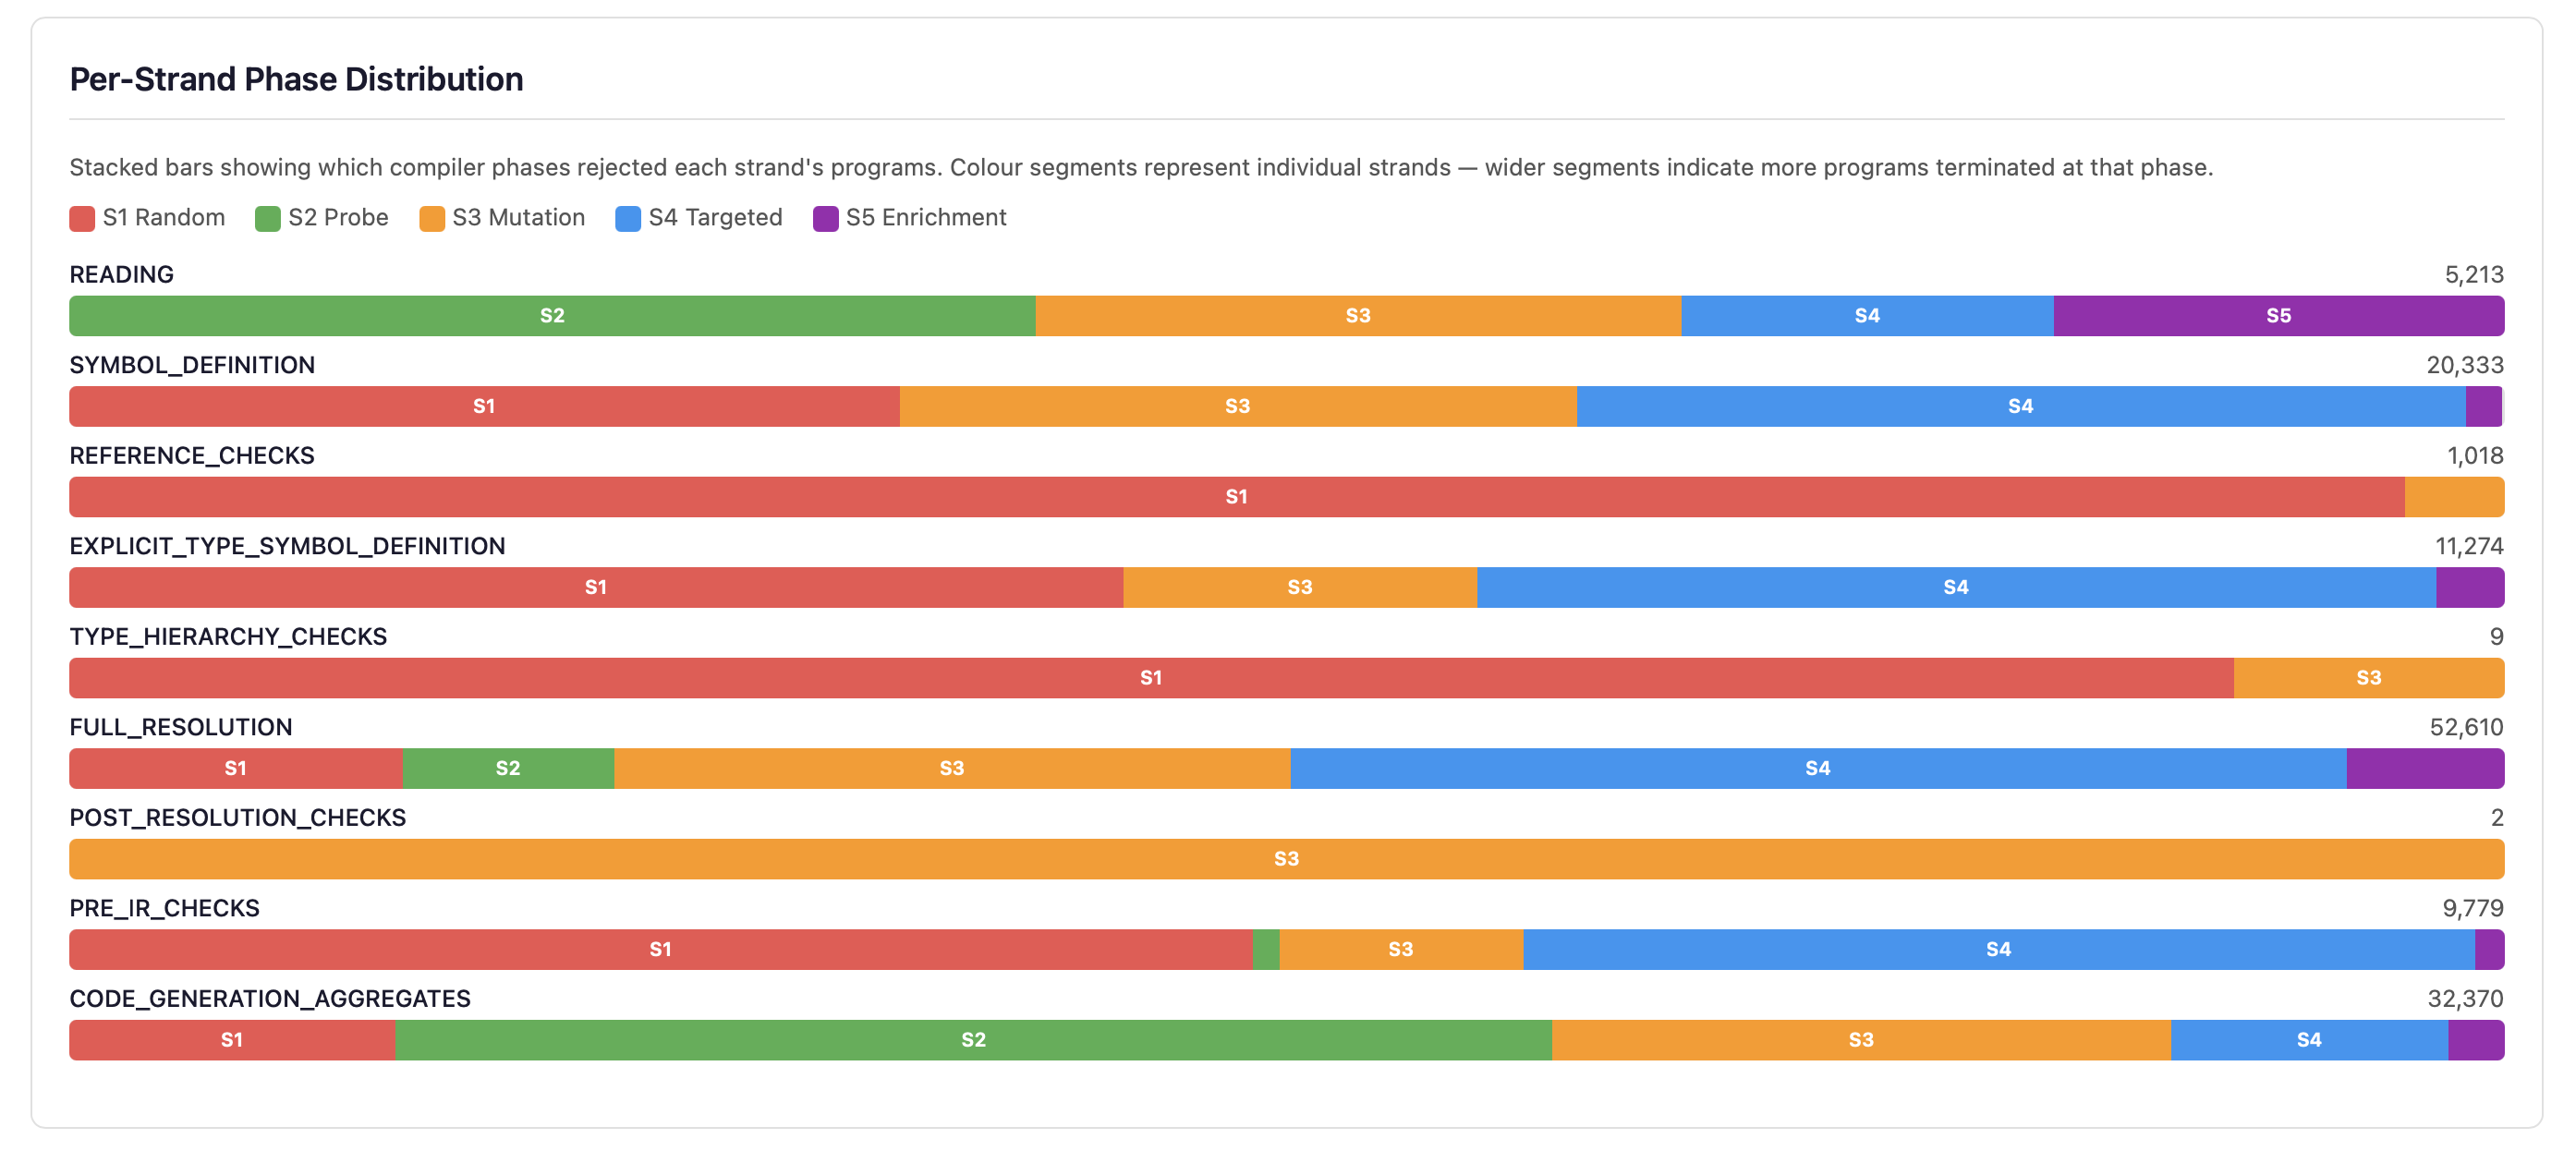
Stacked horizontal bars show how each of the five strands contributes to programs at every compilation phase. Each bar is coloured by strand (S1 red, S2 green, S3 amber, S4 blue, S5 purple), making it easy to see which generation strategy dominates at each phase depth.
Below the bars, the S5 Harvest Summary shows statistics for template enrichment:
- Harvest Successes/Failures — How many Q&A templates were successfully parsed for symbol harvesting. High failure counts suggest stale templates.
- Hierarchy Reverts — Hierarchy injection attempts that were reverted because the generated inheritance was incompatible (e.g., operator conflicts, constructor mismatches).
- Weight Adjustments — Times the adaptive dispatch system adjusted strand weights based on performance feedback (e.g., reducing S2 weight when too many probes fail in READING phase).
- Blind-Spot Triggered — Programs from the blind-spot generator that successfully triggered previously-untriggered error codes, out of total attempts.
Strand Effectiveness Comparison
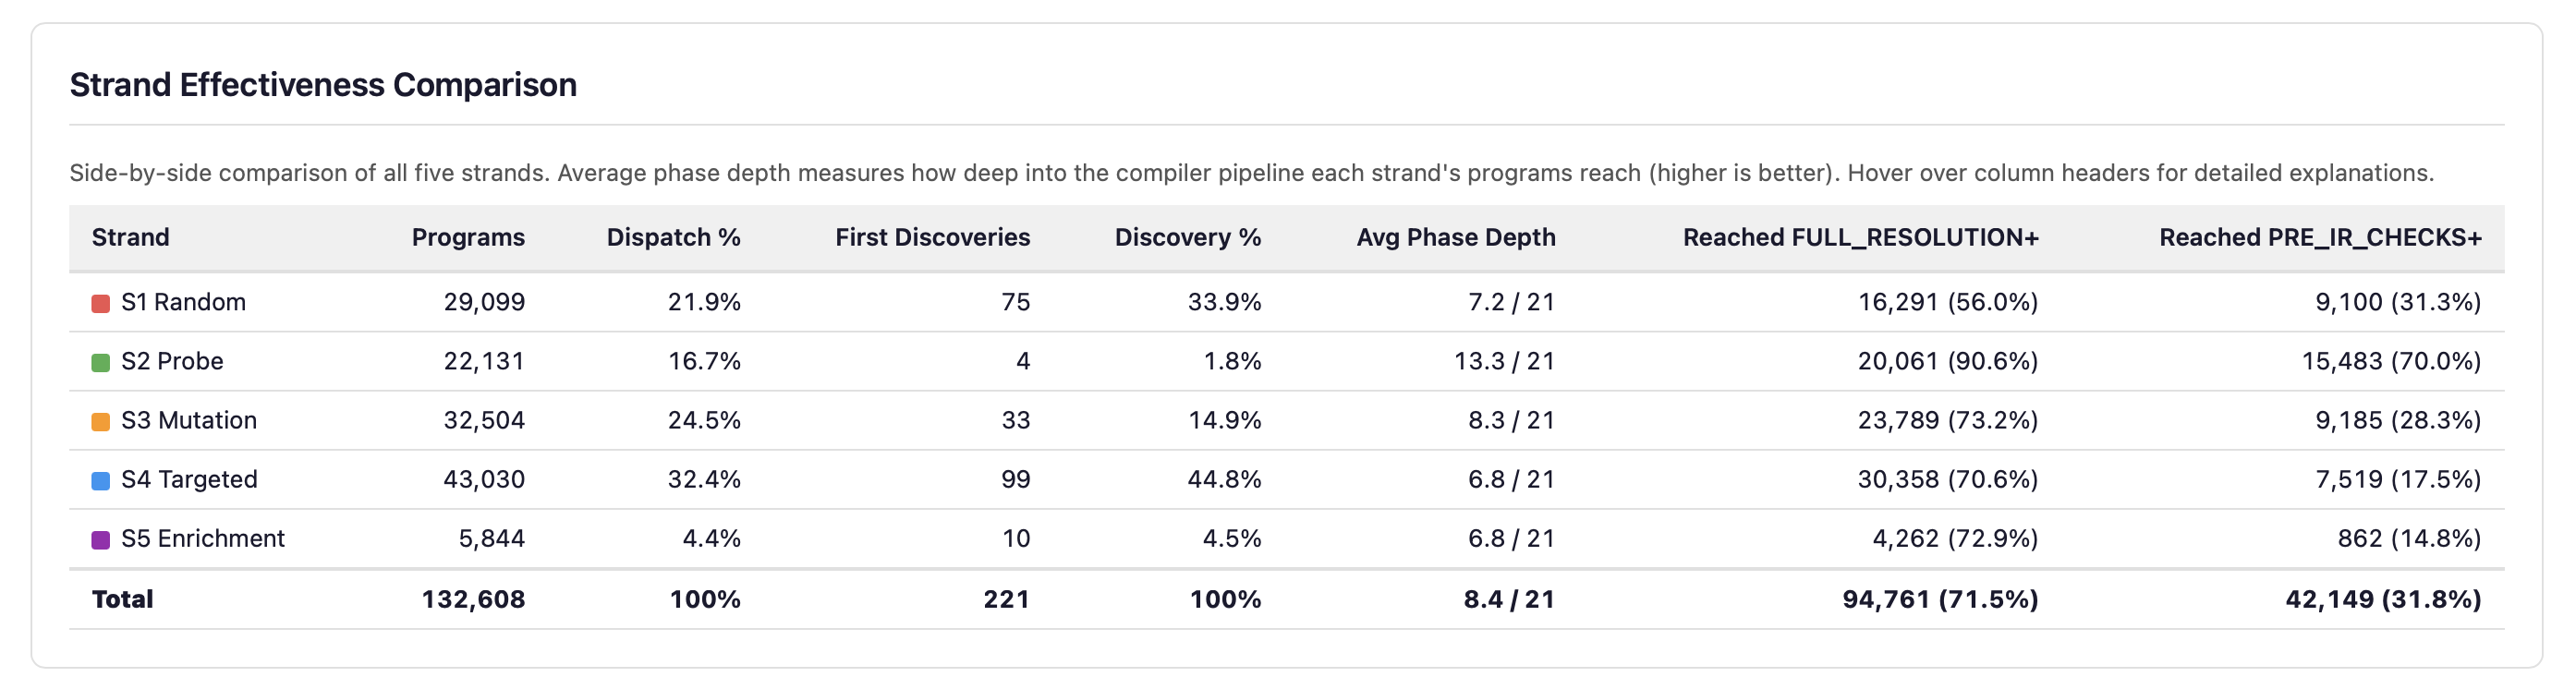
Per-strand metrics side by side: program count, dispatch percentage, first discoveries, average phase depth, and pipeline penetration rates. Depth and breadth of discovery are genuinely orthogonal — the deepest-penetrating strand is not the most productive at discovering new error codes.
Adaptive Weight Timeline
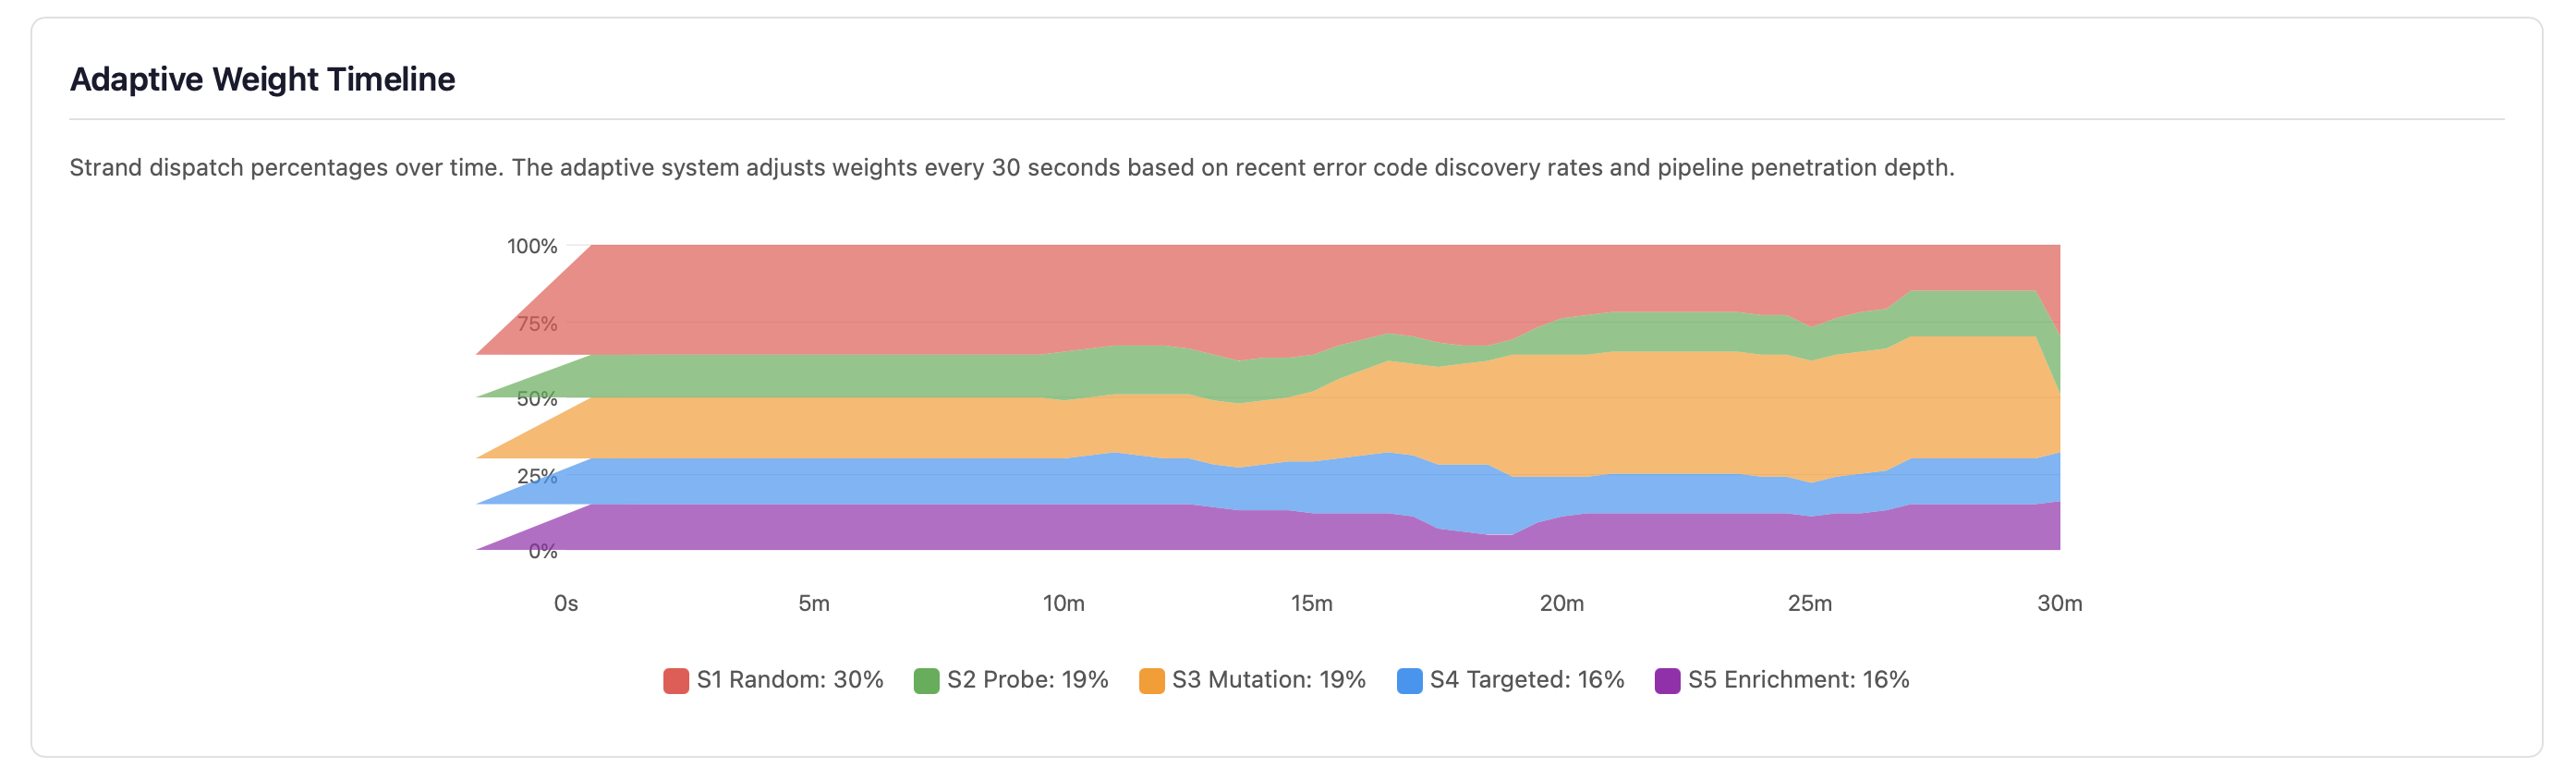
Strand dispatch percentages over time. The adaptive system adjusts weights every 30 seconds based on recent error code discovery rates and pipeline penetration depth. Strands that discover more error codes receive higher dispatch weights; strands that plateau lose budget to more productive strategies.
Strand 4: Targeted Mutation Statistics
This section provides detailed statistics on Strand 4’s known-error mutation testing. Each card shows a specific aspect of mutation effectiveness:
- Match Rate — Percentage of mutations where the compiler detected the
expected error code. A high match rate (>50%) indicates the compiler reliably catches
known-incorrect patterns from the Q&A
typicalErrorsentries. - Mismatches — Mutations that produced an error, but a different
error code than expected. These are saved to
fuzz-crashes/strand4-mismatches/for investigation — they may reveal error detection logic that triggers at a different phase than anticipated. - No Error — Mutations where the compiler accepted the mutated code without any error. These are surviving mutants — they indicate potential gaps in the compiler’s error detection.
- Skips — Mutations where the string replacement had no effect on the source code (the correct snippet was not present in the randomly-selected template).
- Compound — When a single mutation survives (compiles clean), additional mutations from the template mutation generator are layered on top. This shows how many of those compound mutations triggered the expected error, out of total compound attempts.
- Survivors — Surviving mutants that were recycled as input for Strand 3 template mutation, creating a feedback loop. Programs that the compiler incorrectly accepted are further mutated to find related weaknesses.
Error Code Convergence
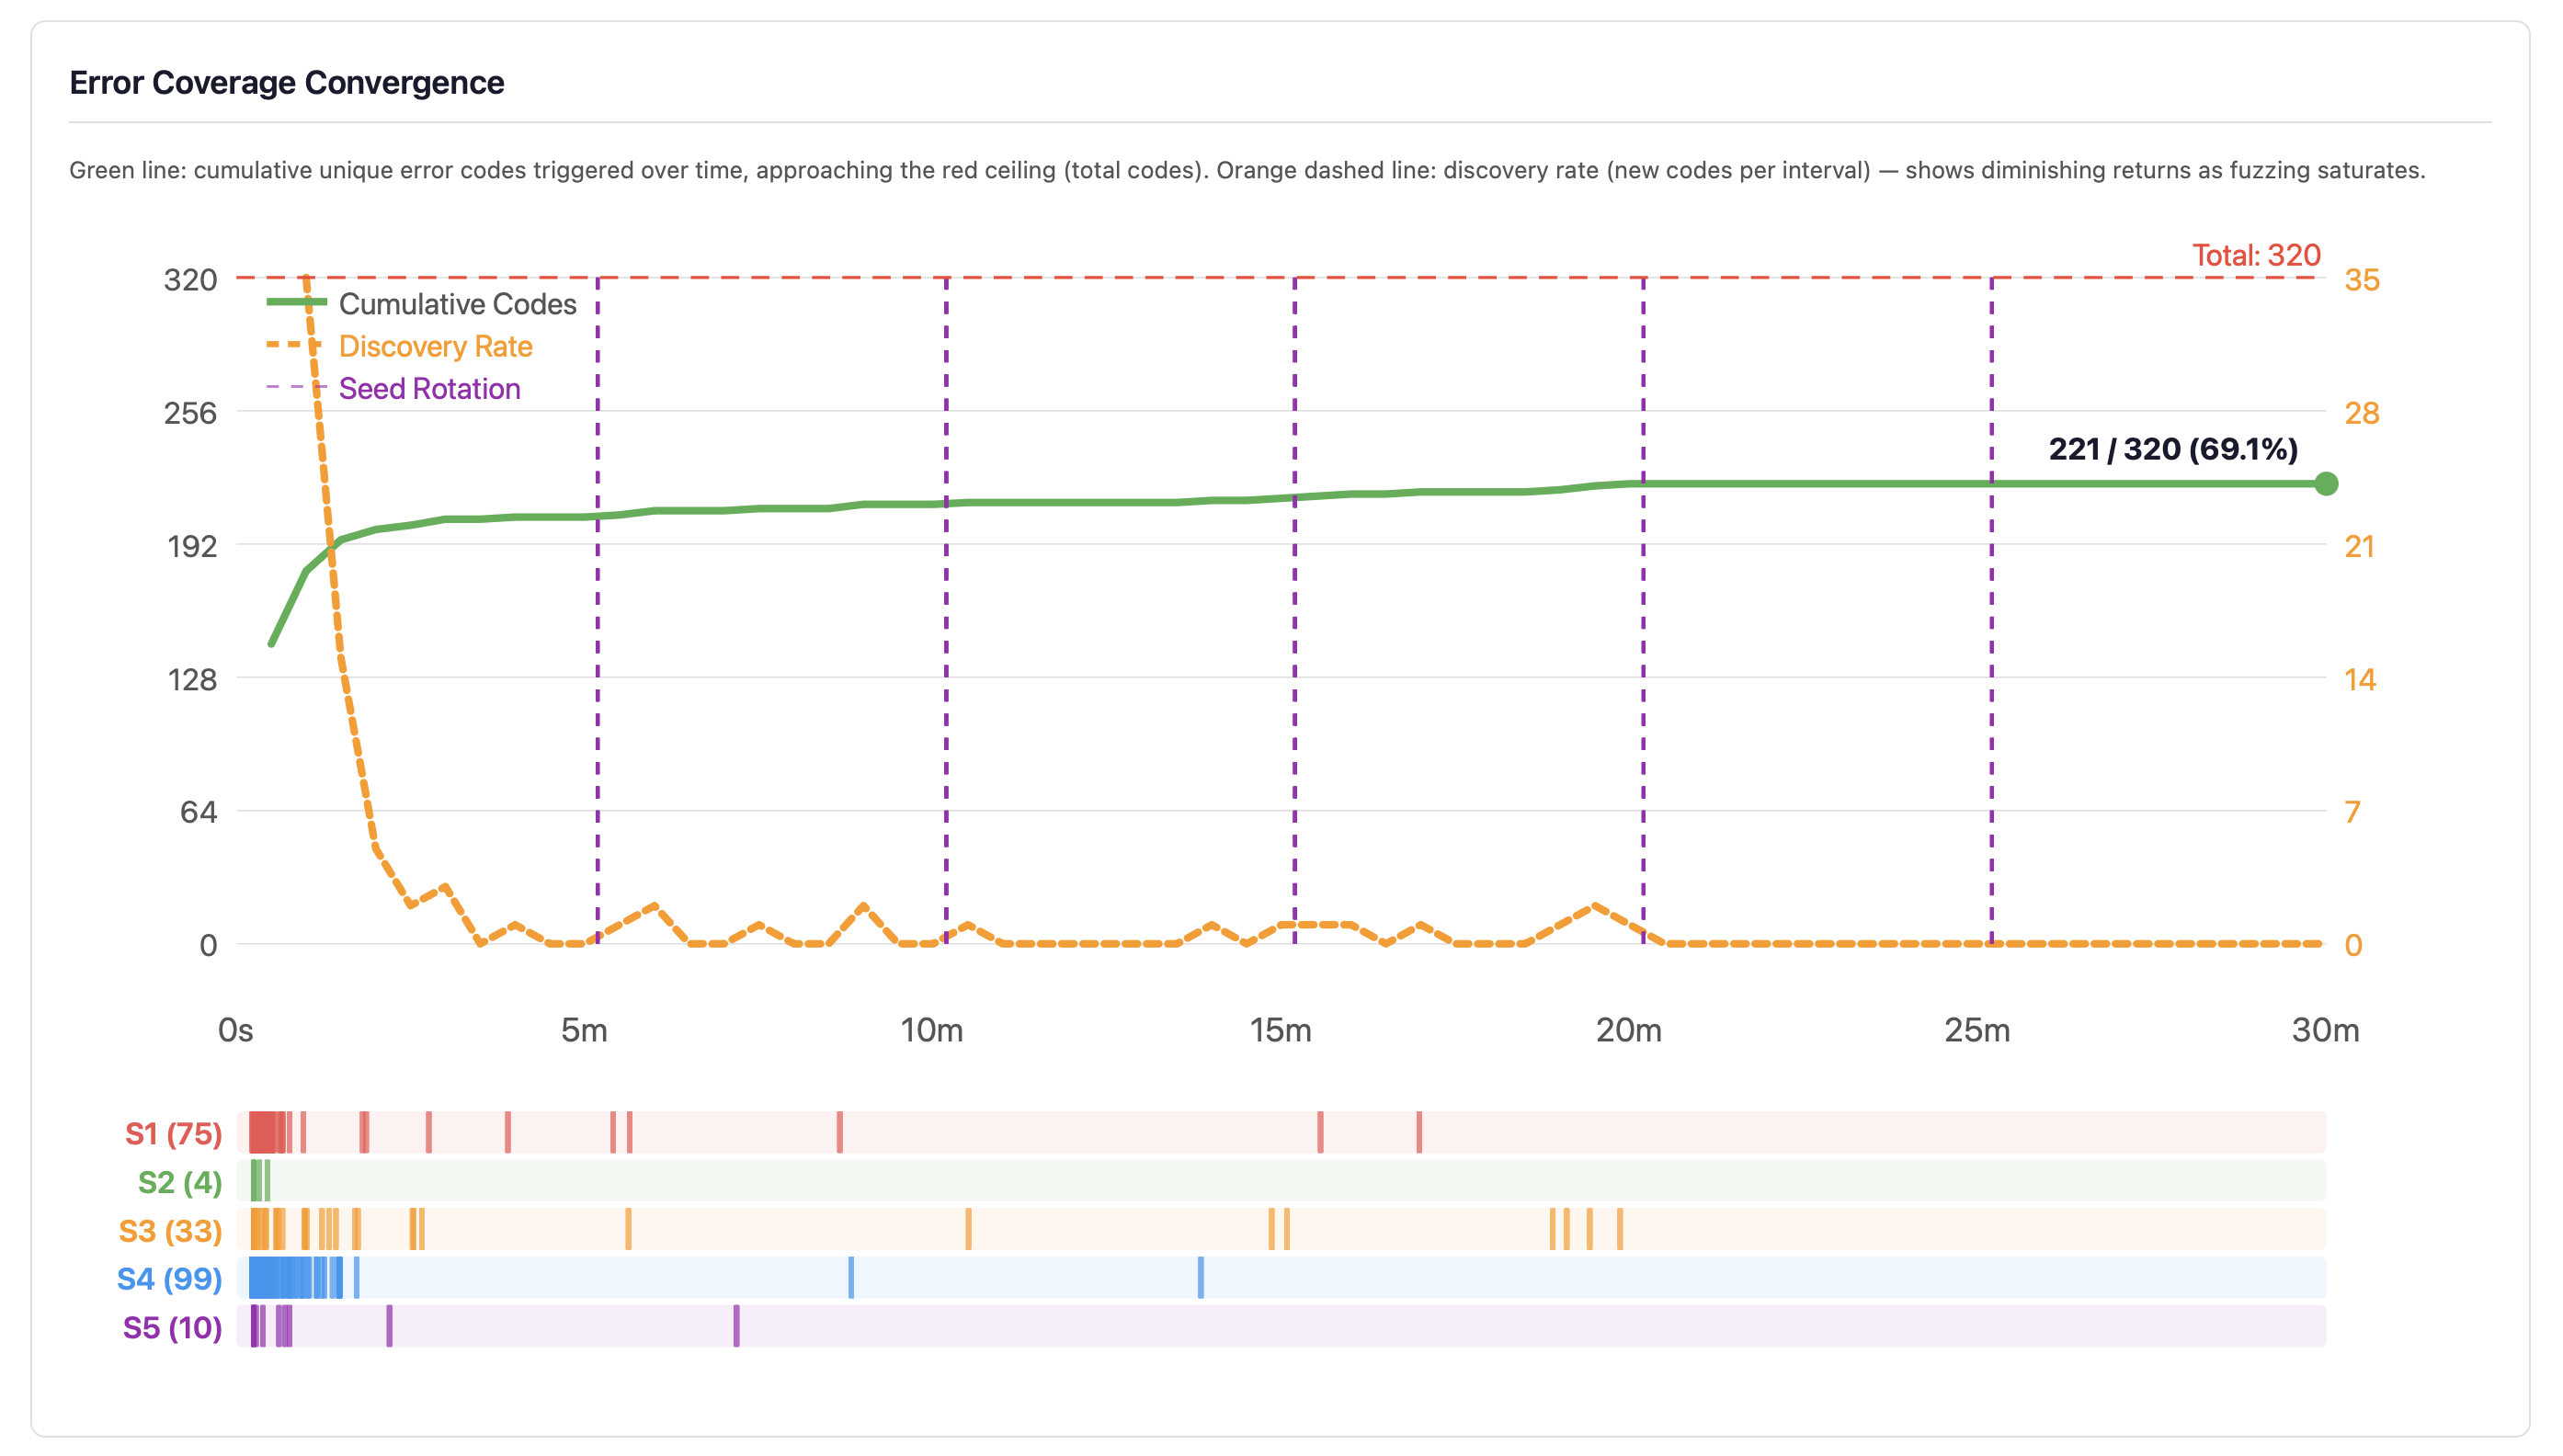
The convergence curve plots cumulative unique error codes triggered over time (green line) against the total error code ceiling (red dashed line), with a discovery rate overlay (orange dashed line). The bottom strip shows per-strand discovery events colour-coded by strand.
When the discovery rate approaches zero — as it typically does after 5–10 minutes — the developer knows that continued fuzzing at current settings will not improve error code coverage. The response is not to fuzz longer at the same settings but to change strategy: improve generators, add new strand types, or target specific untriggered codes. However, error code discovery saturation does not mean bug discovery saturation — the combination space within each error code category remains vast, and longer runs explore more of it.
Best Practices
- Run 24/7, not 5 minutes. Stochastic testing is probabilistic — a short run may miss rare crash conditions. The fuzzer is designed for continuous operation.
- QA the statistics daily. The dashboard is a monitoring system. Check that error coverage is growing, constructs are uniformly exercised, and no new crash patterns have emerged.
- Statistics are the product, not crash files. Crashes are important, but the real value is understanding how much of the compiler has been exercised. A clean run with low error coverage is worse than a crashy run with high coverage.
- Use seeds for reproducibility. When investigating a crash, note the seed from the dashboard and re-run with the same seed to reproduce the exact sequence of generated programs.
- Dark mode toggle. The dashboard includes a dark/light mode toggle for late-night monitoring sessions.
See Also
- Test Generation - Generate edge-case tests and mutation variants for your code
- Testing - Test types, assertions, test runner commands
- Code Coverage - Threshold enforcement, quality metrics, HTML reports
- Command Line - All flags and exit codes
- For AI Assistants - Machine-readable output schemas